
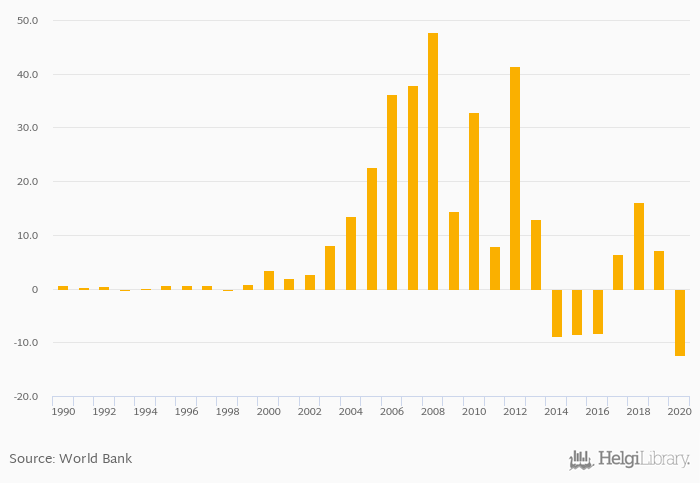
Balance of trade in goods and services fell 271% to LYD -12.4 bil in Libya in 2020, according to the National Statistical Office.
Historically, balance of trade in goods and services in Libya reached an all time high of LYD 47.7 bil in 2008 and an all time low of LYD -12.4 bil in 2020. When compared to Libya's main peers, balance of trade in goods and services in Algeria amounted to DZD -1,809 bil, XAF -944 bil in Chad, EGP -442 bil in Egypt and THD -9.95 bil in Tunisia in 2020.
Libya has been ranked 88th within the group of 161 countries we follow in terms of balance of trade in goods and services, 50 places below the position seen 10 years ago.
| Balance of Trade In Goods and Services (Local Currency) | Unit | 2001 | 2002 | 2003 | 2004 | 2005 | 2006 | 2007 | 2008 | 2009 | 2010 | 2011 | 2012 | 2013 | 2014 | 2015 | 2016 | 2017 | 2018 | 2019 | 2020 | 2021 |
| Algeria | DZD bil | -2,231 | -2,484 | -1,898 | -1,294 | -1,308 | ||||||||||||||||
| Cameroon | XAF bil | -678 | -549 | -523 | -692 | -855 | ||||||||||||||||
| Chad | XAF bil | -425 | -641 | -338 | -114 | -72.0 | ||||||||||||||||
| Egypt | EGP bil | -207 | -259 | -468 | -464 | -439 | ||||||||||||||||
| Israel | ILS bil | 36.9 | 23.1 | 24.8 | 11.8 | 32.3 | ||||||||||||||||
| Italy | EUR bil | 49.9 | 55.8 | 49.7 | 42.6 | 59.8 | ||||||||||||||||
| Libya | LYD bil | -8.38 | -8.30 | 6.41 | 16.2 | 7.23 | ... | |||||||||||||||
| Malta | EUR bil | 0.976 | 1.33 | 2.22 | 2.26 | 2.37 | ||||||||||||||||
| Morocco | MAD bil | -78.7 | -106 | -103 | -115 | -96.9 | ||||||||||||||||
| Niger | XOF bil | -927 | -747 | -842 | -1,029 | -1,125 | ||||||||||||||||
| Nigeria | NGN bil | -0.031 | -2,345 | -5.14 | -2,600 | -8,130 | ||||||||||||||||
| Saudi Arabia | SAR bil | -110 | 10.3 | 143 | 395 | 251 | ||||||||||||||||
| Spain | EUR bil | 32.8 | 44.4 | 41.9 | 32.7 | 36.6 | ||||||||||||||||
| Sudan | SDG bil | -0.206 | -0.192 | -1.16 | -0.957 | 0.828 | ||||||||||||||||
| Tunisia | THD bil | -9.38 | -10.0 | -12.6 | -14.6 | -12.8 |
 Helgi Library


