
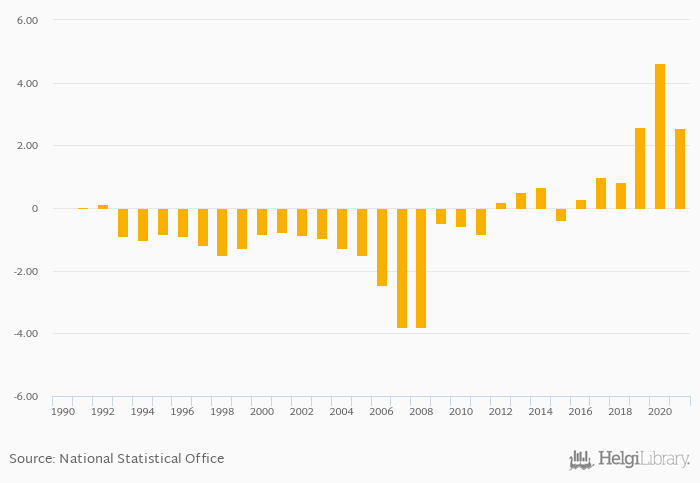
Balance of trade in goods and services fell 45.2% to EUR 2.54 bil in Lithuania in 2021, according to the National Statistical Office.
Historically, balance of trade in goods and services in Lithuania reached an all time high of EUR 4.63 bil in 2020 and an all time low of EUR -3.80 bil in 2007. When compared to Lithuania's main peers, balance of trade in goods and services in Belarus amounted to BYR 9.49 bil, EUR -0.115 bil in Estonia, EUR -1.15 bil in Latvia and RUB 12,505 bil in Russia in 2021.
Lithuania has been ranked 56th within the group of 152 countries we follow in terms of balance of trade in goods and services, 17 places above the position seen 10 years ago.
| Balance of Trade In Goods and Services (Local Currency) | Unit | 2001 | 2002 | 2003 | 2004 | 2005 | 2006 | 2007 | 2008 | 2009 | 2010 | 2011 | 2012 | 2013 | 2014 | 2015 | 2016 | 2017 | 2018 | 2019 | 2020 | 2021 |
| Belarus | BYR bil | 0.096 | -0.181 | 0.224 | 1.85 | -0.891 | ||||||||||||||||
| China | CNY bil | 2,235 | 1,698 | 1,458 | 605 | 917 | ||||||||||||||||
| Estonia | EUR bil | 0.812 | 0.784 | 0.967 | 0.707 | 1.11 | ||||||||||||||||
| Finland | EUR bil | -1.20 | -2.78 | 0.104 | -2.93 | 0.374 | ||||||||||||||||
| Germany | EUR bil | 230 | 231 | 232 | 205 | 196 | ||||||||||||||||
| Japan | JPY bil | -2,980 | 4,386 | 4,202 | 111 | -1,614 | ||||||||||||||||
| Latvia | EUR bil | -0.418 | 0.089 | -0.170 | -0.194 | -0.202 | ||||||||||||||||
| Lithuania | EUR bil | -0.372 | 0.280 | 0.980 | 0.827 | 2.60 | ||||||||||||||||
| Poland | PLN bil | 37.4 | 55.5 | 56.1 | 43.5 | 84.7 | ||||||||||||||||
| Russia | RUB bil | 6,686 | 4,444 | 4,873 | 10,392 | 8,372 | ||||||||||||||||
| USA | UYU bil | -526 | -506 | -537 | -593 | -579 | ||||||||||||||||
| Ukraine | UAH bil | -51.9 | -165 | -232 | -311 | -320 |
 Helgi Library


