
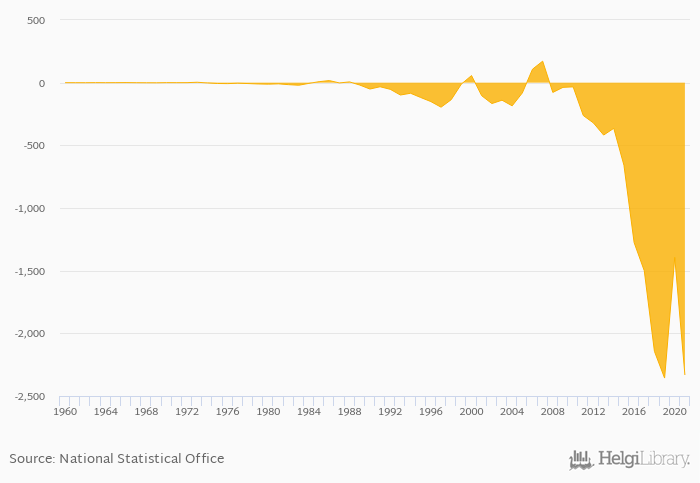
Balance of trade in goods and services fell 67.4% to PHP -2,333 bil in Philippines in 2021, according to the National Statistical Office.
Historically, balance of trade in goods and services in Philippines reached an all time high of PHP 172 bil in 2007 and an all time low of PHP -2,357 bil in 2019.
Philippines has been ranked 138th within the group of 152 countries we follow in terms of balance of trade in goods and services, 4 places below the position seen 10 years ago.
| Balance of Trade In Goods and Services (Local Currency) | Unit | 2001 | 2002 | 2003 | 2004 | 2005 | 2006 | 2007 | 2008 | 2009 | 2010 | 2011 | 2012 | 2013 | 2014 | 2015 | 2016 | 2017 | 2018 | 2019 | 2020 | 2021 |
| Australia | AUD bil | -24.1 | -37.8 | 8.99 | 6.58 | 48.2 | ||||||||||||||||
| Cambodia | KHR bil | -3,251 | -3,564 | -3,076 | -1,699 | -1,512 | ||||||||||||||||
| China | CNY bil | 2,235 | 1,698 | 1,458 | 605 | 917 | ||||||||||||||||
| Hong Kong | HKD bil | 57.3 | 56.9 | 26.8 | -6.06 | 44.2 | ||||||||||||||||
| India | INR bil | -3,163 | -2,718 | -5,399 | -7,109 | -5,180 | ||||||||||||||||
| Indonesia | IDR bil | 44,113 | 93,837 | 135,778 | -158,599 | -70,411 | ||||||||||||||||
| Japan | JPY bil | -2,980 | 4,386 | 4,202 | 111 | -1,614 | ||||||||||||||||
| Laos | LAK bil | -20,981 | -11,212 | -10,057 | ... | ... | ... | ... | ||||||||||||||
| Malaysia | MYR bil | 88.6 | 83.1 | 94.3 | 97.1 | 114 | ||||||||||||||||
| Philippines | PHP bil | -659 | -1,276 | -1,501 | -2,144 | -2,357 | ||||||||||||||||
| Russia | RUB bil | 6,686 | 4,444 | 4,873 | 10,392 | 8,372 | ||||||||||||||||
| Singapore | SGD bil | 116 | 115 | 125 | 147 | 147 | ||||||||||||||||
| Taiwan | TWD bil | ... | ... | ... | ... | ... | ... | ... | ... | ... | ... | ... | ... | ... | ... | ... | ... | ... | ... | ... | ... | ... |
| Thailand | THB bil | 1,434 | 1,979 | 1,929 | 1,446 | 1,579 | ||||||||||||||||
| USA | UYU bil | -526 | -506 | -537 | -593 | -579 | ||||||||||||||||
| Vietnam | VND bil | 48,356 | 158,189 | 160,177 | 293,187 | 432,448 |
 Helgi Library


