
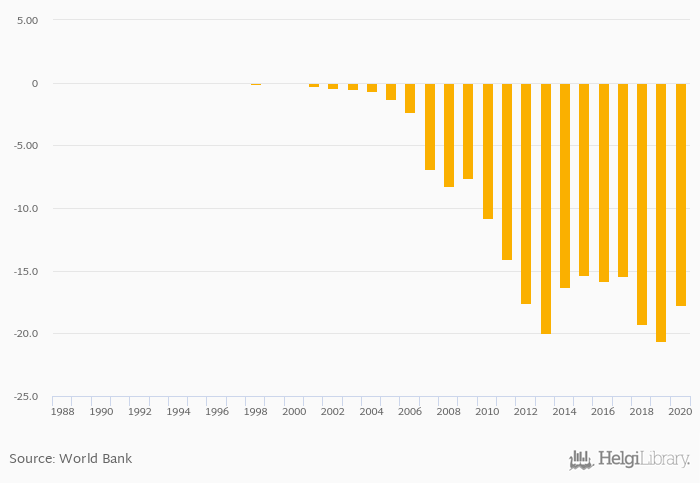
Balance of trade in goods and services rose 14.2% to TJS -17.7 bil in Tajikistan in 2020, according to the National Statistical Office.
Historically, balance of trade in goods and services in Tajikistan reached an all time high of TJS < 0.001 bil in 1991 and an all time low of TJS -20.6 bil in 2019.
Tajikistan has been ranked 93rd within the group of 161 countries we follow in terms of balance of trade in goods and services, 6 places above the position seen 10 years ago.
| Balance of Trade In Goods and Services (Local Currency) | Unit | 2001 | 2002 | 2003 | 2004 | 2005 | 2006 | 2007 | 2008 | 2009 | 2010 | 2011 | 2012 | 2013 | 2014 | 2015 | 2016 | 2017 | 2018 | 2019 | 2020 | 2021 |
| Afghanistan | AFN bil | ... | -388 | -470 | -542 | ... | ... | ... | ... | |||||||||||||
| China | CNY bil | 2,235 | 1,698 | 1,458 | 605 | 917 | ||||||||||||||||
| India | INR bil | -3,163 | -2,718 | -5,399 | -7,109 | -5,180 | ||||||||||||||||
| Iran | IQD bil | -239,768 | 278,894 | 121,591 | 441,076 | -1,036,166 | ||||||||||||||||
| Japan | JPY bil | -2,980 | 4,386 | 4,202 | 111 | -1,614 | ||||||||||||||||
| Kazakhstan | KZT bil | 1,629 | 1,586 | 4,334 | 7,247 | 5,576 | ||||||||||||||||
| Kyrgyzstan | KGS bil | -175 | -163 | -170 | -203 | -179 | ||||||||||||||||
| Pakistan | PKR bil | -1,769 | -2,365 | -3,210 | -4,100 | -4,434 | ||||||||||||||||
| Russia | RUB bil | 6,686 | 4,444 | 4,873 | 10,392 | 8,372 | ||||||||||||||||
| Tajikistan | TJS bil | -15.4 | -15.9 | -15.4 | -19.3 | -20.6 | ... | |||||||||||||||
| Turkmenistan | TMT bil | -12.5 | -22.5 | -11.5 | 14.5 | ... | ... | ... | ||||||||||||||
| USA | UYU bil | -526 | -506 | -537 | -593 | -579 | ||||||||||||||||
| Uzbekistan | UZS bil | -7,123 | -11,561 | -19,965 | -74,762 | -84,779 |
 Helgi Library


