
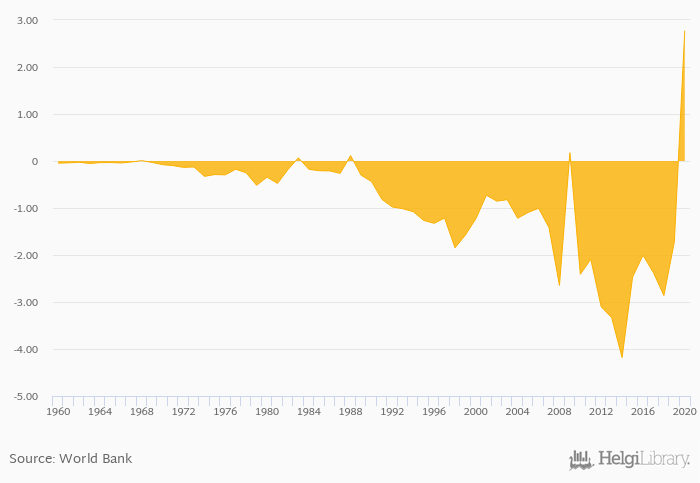
Balance of trade in goods and services rose 261% to PAB 2.77 bil in Panama in 2020, according to the National Statistical Office.
Historically, balance of trade in goods and services in Panama reached an all time high of PAB 2.77 bil in 2020 and an all time low of PAB -4.18 bil in 2014. When compared to Panama's main peers, balance of trade in goods and services in Colombia amounted to COP -69,136 bil, CRC 1,078 bil in Costa Rica, HNL -90.4 bil in Honduras and NIO -21.7 bil in Nicaragua in 2020.
Panama has been ranked 56th within the group of 163 countries we follow in terms of balance of trade in goods and services, 23 places above the position seen 10 years ago.
| Balance of Trade In Goods and Services (Local Currency) | Unit | 2001 | 2002 | 2003 | 2004 | 2005 | 2006 | 2007 | 2008 | 2009 | 2010 | 2011 | 2012 | 2013 | 2014 | 2015 | 2016 | 2017 | 2018 | 2019 | 2020 | 2021 |
| Belize | BZD bil | -0.041 | -0.084 | 0.086 | 0.113 | 0.076 | ||||||||||||||||
| Brazil | BRL bil | -69.1 | 25.1 | 47.3 | 27.6 | -47.6 | ||||||||||||||||
| Colombia | COP bil | -56,814 | -58,464 | -45,953 | -46,775 | -61,722 | ||||||||||||||||
| Costa Rica | CRC bil | -230 | 110 | 156 | 191 | 1,093 | ||||||||||||||||
| El Salvador | SVC bil | -4.12 | -3.85 | -4.06 | -4.62 | -4.34 | ||||||||||||||||
| Guatemala | GTQ bil | -48.7 | -44.5 | -47.8 | -58.8 | -61.1 | ||||||||||||||||
| Honduras | HNL bil | -78.0 | -71.4 | -84.9 | -119 | -112 | ||||||||||||||||
| Mexico | MXN bil | -379 | -398 | -398 | -481 | -62.3 | ||||||||||||||||
| Nicaragua | NIO bil | -62.7 | -61.0 | -56.8 | -38.8 | -18.7 | ||||||||||||||||
| Panama | PAB bil | -2.47 | -2.01 | -2.38 | -2.86 | -1.72 | ||||||||||||||||
| Peru | PEN bil | -15.6 | -1.22 | 13.3 | 12.8 | 8.65 | ||||||||||||||||
| USA | UYU bil | -526 | -506 | -537 | -593 | -579 | ||||||||||||||||
| Venezuela | VEF bil | ... | ... | ... | ... | ... | ... | ... |
 Helgi Library


