
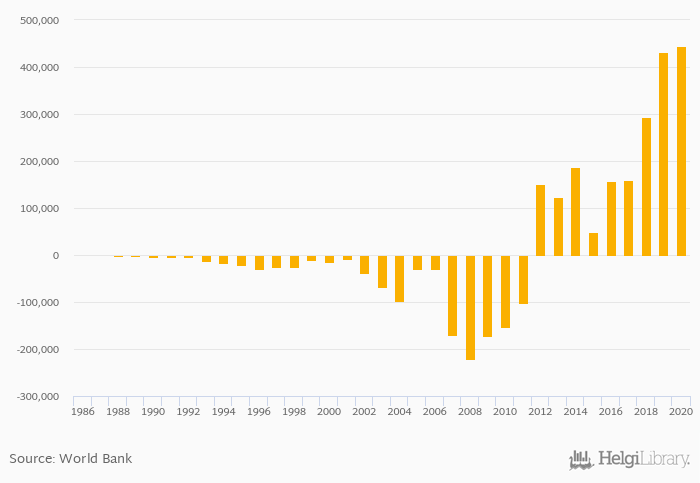
Balance of trade in goods and services rose 2.63% to VND 443,836 bil in Vietnam in 2020, according to the National Statistical Office.
Historically, balance of trade in goods and services in Vietnam reached an all time high of VND 443,836 bil in 2020 and an all time low of VND -220,495 bil in 2008.
Vietnam has been ranked 1st within the group of 163 countries we follow in terms of balance of trade in goods and services, 170 places above the position seen 10 years ago.
| Balance of Trade In Goods and Services (Local Currency) | Unit | 2001 | 2002 | 2003 | 2004 | 2005 | 2006 | 2007 | 2008 | 2009 | 2010 | 2011 | 2012 | 2013 | 2014 | 2015 | 2016 | 2017 | 2018 | 2019 | 2020 | 2021 |
| Cambodia | KHR bil | -3,251 | -3,564 | -3,076 | -1,699 | -1,512 | ||||||||||||||||
| China | CNY bil | 2,235 | 1,698 | 1,458 | 605 | 917 | ||||||||||||||||
| India | INR bil | -3,163 | -2,718 | -5,399 | -7,109 | -5,180 | ||||||||||||||||
| Japan | JPY bil | -2,980 | 4,386 | 4,202 | 111 | -1,614 | ||||||||||||||||
| Laos | LAK bil | -20,981 | -11,212 | -10,057 | ... | ... | ... | ... | ||||||||||||||
| Malaysia | MYR bil | 88.6 | 83.1 | 94.3 | 97.1 | 114 | ||||||||||||||||
| Myanmar | MMK bil | -2,773 | -5,911 | -7,555 | -5,316 | 95.3 | ||||||||||||||||
| Russia | RUB bil | 6,686 | 4,444 | 4,873 | 10,392 | 8,372 | ||||||||||||||||
| Thailand | THB bil | 1,434 | 1,979 | 1,929 | 1,446 | 1,579 | ||||||||||||||||
| USA | UYU bil | -526 | -506 | -537 | -593 | -579 | ||||||||||||||||
| Vietnam | VND bil | 48,356 | 158,189 | 160,177 | 293,187 | 432,448 |
 Helgi Library


