
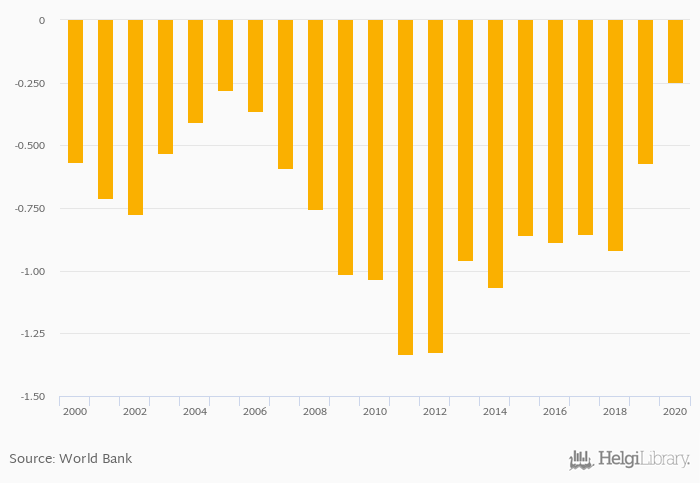
Balance of trade in goods and services rose 56.9% to USD -0.246 bil in East Timor in 2020, according to the National Statistical Office.
Historically, balance of trade in goods and services in East Timor reached an all time high of USD -0.246 bil in 2020 and an all time low of USD -1.33 bil in 2011.
East Timor has been ranked 70th within the group of 163 countries we follow in terms of balance of trade in goods and services, 2 places above the position seen 10 years ago.
| Balance of Trade In Goods and Services (Local Currency) | Unit | 2001 | 2002 | 2003 | 2004 | 2005 | 2006 | 2007 | 2008 | 2009 | 2010 | 2011 | 2012 | 2013 | 2014 | 2015 | 2016 | 2017 | 2018 | 2019 | 2020 | 2021 |
| Australia | AUD bil | -24.1 | -37.8 | 8.99 | 6.58 | 48.2 | ||||||||||||||||
| Cambodia | KHR bil | -3,251 | -3,564 | -3,076 | -1,699 | -1,512 | ||||||||||||||||
| East Timor | USD bil | -0.858 | -0.886 | -0.853 | -0.917 | -0.571 | ||||||||||||||||
| Indonesia | IDR bil | 44,113 | 93,837 | 135,778 | -158,599 | -70,411 | ||||||||||||||||
| Malaysia | MYR bil | 88.6 | 83.1 | 94.3 | 97.1 | 114 | ||||||||||||||||
| New Zealand | NZD bil | 2.43 | 2.09 | 2.75 | -0.137 | 0.968 | ||||||||||||||||
| Papua New Guinea | PGK bil | ... | ... | ... | ... | ... | ... | ... | ... | ... | ... | ... | ... | ... | ... | ... | ... | ... | ||||
| Philippines | PHP bil | -659 | -1,276 | -1,501 | -2,144 | -2,357 | ||||||||||||||||
| Singapore | SGD bil | 116 | 115 | 125 | 147 | 147 | ||||||||||||||||
| Thailand | THB bil | 1,434 | 1,979 | 1,929 | 1,446 | 1,579 | ||||||||||||||||
| Vietnam | VND bil | 48,356 | 158,189 | 160,177 | 293,187 | 432,448 |
 Helgi Library


