
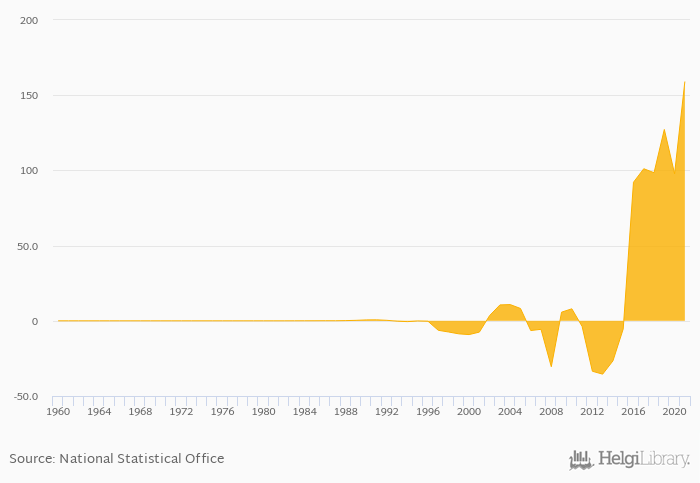
Balance of trade in goods and services rose 62.7% to USD 159 bil in Uruguay in 2021, according to the National Statistical Office.
Historically, balance of trade in goods and services in Uruguay reached an all time high of USD 159 bil in 2021 and an all time low of USD -35.5 bil in 2013. When compared to Uruguay's main peers, balance of trade in goods and services in Argentina amounted to ARS 1,430 bil, BRL 88.4 bil in Brazil, CLP -1,566 bil in Chile and PYG 3,105 bil in Paraguay in 2021.
Uruguay has been ranked 29th within the group of 152 countries we follow in terms of balance of trade in goods and services, 58 places above the position seen 10 years ago.
| Balance of Trade In Goods and Services (Local Currency) | Unit | 2001 | 2002 | 2003 | 2004 | 2005 | 2006 | 2007 | 2008 | 2009 | 2010 | 2011 | 2012 | 2013 | 2014 | 2015 | 2016 | 2017 | 2018 | 2019 | 2020 | 2021 |
| Argentina | ARS bil | -64.0 | -85.5 | -282 | -279 | 694 | ||||||||||||||||
| Bolivia | BOB bil | -14.1 | -17.4 | -17.9 | -14.3 | -18.3 | ||||||||||||||||
| Brazil | BRL bil | -69.1 | 25.1 | 47.3 | 27.6 | -47.6 | ||||||||||||||||
| Chile | CLP bil | -1,534 | -357 | 1,142 | -2,120 | -3,642 | ||||||||||||||||
| Paraguay | PYG bil | 4,884 | 13,389 | 11,831 | 3,140 | 2,455 | ||||||||||||||||
| Peru | PEN bil | -15.6 | -1.22 | 13.3 | 12.8 | 8.65 | ||||||||||||||||
| Uruguay | USD bil | -5.42 | 92.1 | 101 | 98.5 | 127 | ||||||||||||||||
| Venezuela | VEF bil | ... | ... | ... | ... | ... | ... | ... |
 Helgi Library


