
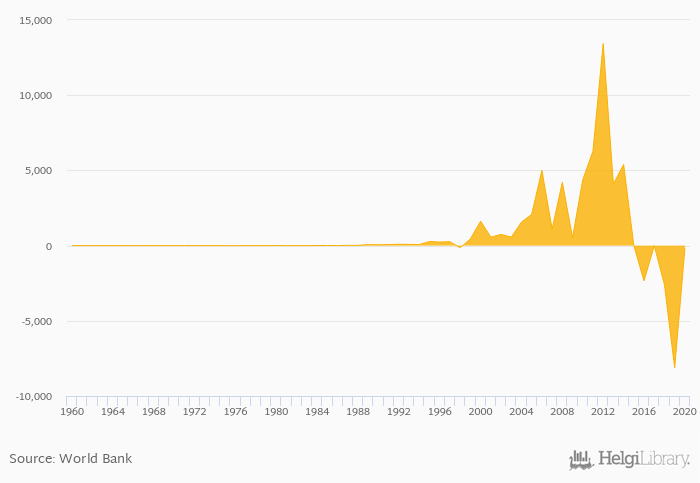
Balance of trade in goods and services rose 97.8% to NGN -178 bil in Nigeria in 2020, according to the National Statistical Office.
Historically, balance of trade in goods and services in Nigeria reached an all time high of NGN 13,429 bil in 2012 and an all time low of NGN -8,130 bil in 2019. When compared to Nigeria's main peers, balance of trade in goods and services in Benin amounted to XOF -458 bil, XAF -767 bil in Cameroon, XAF -944 bil in Chad and XOF -1,225 bil in Niger in 2020.
Nigeria has been ranked 119th within the group of 163 countries we follow in terms of balance of trade in goods and services, 112 places below the position seen 10 years ago.
| Balance of Trade In Goods and Services (Local Currency) | Unit | 2001 | 2002 | 2003 | 2004 | 2005 | 2006 | 2007 | 2008 | 2009 | 2010 | 2011 | 2012 | 2013 | 2014 | 2015 | 2016 | 2017 | 2018 | 2019 | 2020 | 2021 |
| Algeria | DZD bil | -2,231 | -2,484 | -1,898 | -1,294 | -1,308 | ||||||||||||||||
| Benin | XOF bil | -493 | -264 | -521 | -574 | -373 | ||||||||||||||||
| Burkina Faso | XOF bil | -481 | -461 | -521 | -392 | -325 | ... | ... | ||||||||||||||
| Cameroon | XAF bil | -678 | -549 | -523 | -692 | -855 | ||||||||||||||||
| Central African Republic | XAF bil | -191 | -226 | -272 | -219 | -241 | ||||||||||||||||
| Chad | XAF bil | -425 | -641 | -338 | -114 | -72.0 | ||||||||||||||||
| Gabon | XAF bil | 1,540 | 1,491 | 2,201 | 2,957 | 2,910 | ||||||||||||||||
| Libya | LYD bil | -8.38 | -8.30 | 6.41 | 16.2 | 7.23 | ... | |||||||||||||||
| Mali | XOF bil | -1,205 | -1,403 | -1,217 | -1,053 | -1,240 | ||||||||||||||||
| Niger | XOF bil | -927 | -747 | -842 | -1,029 | -1,125 | ||||||||||||||||
| Nigeria | NGN bil | -0.031 | -2,345 | -5.14 | -2,600 | -8,130 | ||||||||||||||||
| Sudan | SDG bil | -0.206 | -0.192 | -1.16 | -0.957 | 0.828 | ||||||||||||||||
| Togo | XOF bil | -543 | -467 | -282 | -348 | -349 |
 Helgi Library


