
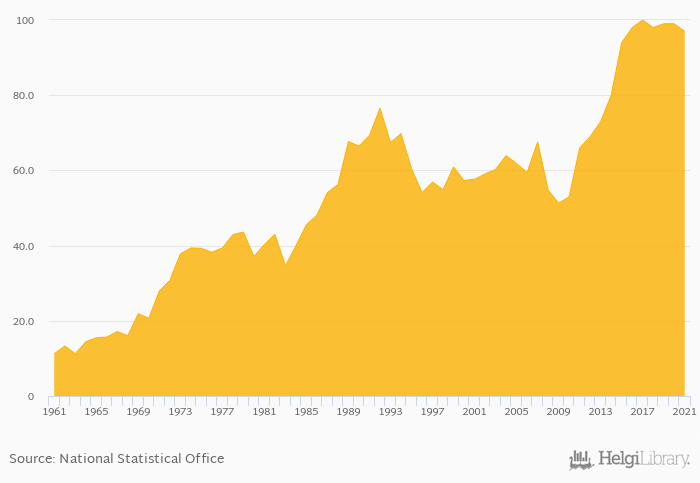
Total banana consumption fell 2.02% to 97.0 kt in Finland in 2021, according to Faostat.
Historically, total banana consumption in Finland reached an all time high of 100 kt in 2017 and an all time low of 11.2 kt in 1961. When compared to Finland's main peers, total banana consumption in Australia amounted to 311 kt, 8,287 kt in Indonesia, 62.0 kt in New Zealand and 1,165 kt in Papua New Guinea in 2021.
Finland has been ranked 71st within the group of 149 countries we follow in terms of total banana consumption, 5 places above the position seen 10 years ago.
| Banana Consumption (Total) | Unit | 2001 | 2002 | 2003 | 2004 | 2005 | 2006 | 2007 | 2008 | 2009 | 2010 | 2011 | 2012 | 2013 | 2014 | 2015 | 2016 | 2017 | 2018 | 2019 | 2020 | 2021 |
| Australia | kt | 227 | 319 | 372 | 337 | 279 | ||||||||||||||||
| Finland | kt | 94.0 | 98.0 | 100 | 98.0 | 99.0 | ||||||||||||||||
| Indonesia | kt | 8,317 | 6,130 | 6,273 | 6,350 | 6,362 | ||||||||||||||||
| Malaysia | kt | 255 | 245 | 276 | 263 | 268 | ||||||||||||||||
| New Zealand | kt | 52.0 | 66.0 | 70.0 | 62.0 | 63.0 | ||||||||||||||||
| Papua New Guinea | kt | ... | ... | ... | ... | ... | ... | ... | ... | ... | 1,084 | 1,123 | 1,156 | 1,188 | 1,120 | |||||||
| Philippines | kt | 3,808 | 3,639 | 2,612 | 2,134 | 2,810 | ||||||||||||||||
| Singapore | kt | ... | ... | ... | ... | ... | ... | ... | ... | ... | ... | ... | ... | ... | ... | ... | ... | ... | ... | ... | ... | ... |
 Helgi Library


