
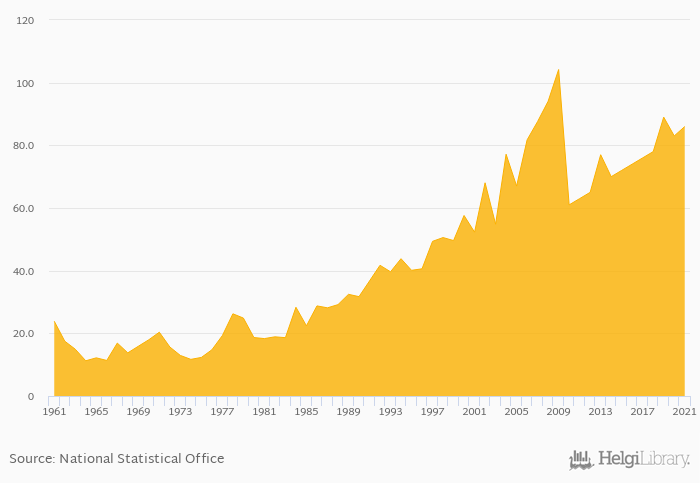
Total bean consumption rose 3.61% to 86.0 kt in Benin in 2021, according to Faostat.
Historically, total bean consumption in Benin reached an all time high of 104 kt in 2009 and an all time low of 11.2 kt in 1964.
Benin has been ranked 35th within the group of 133 countries we follow in terms of total bean consumption, 4 places above the position seen 10 years ago.
| Bean Consumption (Total) | Unit | 2001 | 2002 | 2003 | 2004 | 2005 | 2006 | 2007 | 2008 | 2009 | 2010 | 2011 | 2012 | 2013 | 2014 | 2015 | 2016 | 2017 | 2018 | 2019 | 2020 | 2021 |
| Algeria | kt | 68.0 | 64.0 | 58.0 | 70.0 | 67.0 | ||||||||||||||||
| Benin | kt | 72.0 | 74.0 | 76.0 | 78.0 | 89.0 | ||||||||||||||||
| Burkina Faso | kt | ... | ... | ... | ... | ... | ... | ... | ... | ... | ... | ... | ... | ... | ... | |||||||
| Cameroon | kt | 313 | 323 | 332 | 342 | 348 | ||||||||||||||||
| Chad | kt | 110 | 110 | 115 | 120 | 125 | ||||||||||||||||
| Ghana | kt | 216 | 147 | 171 | 176 | 186 | ||||||||||||||||
| Ivory Coast | kt | 38.0 | 39.0 | 38.0 | 38.0 | 30.0 | ||||||||||||||||
| Libya | kt | ... | ... | ... | ... | ... | ... | ... | ... | ... | 1.00 | 1.00 | 5.00 | 10.0 | 4.00 | |||||||
| Mali | kt | ... | 20.0 | 20.0 | 21.0 | 20.0 | 23.0 | |||||||||||||||
| Niger | kt | 7.00 | 8.00 | 12.0 | 9.00 | 12.0 | ||||||||||||||||
| Nigeria | kt | 1.00 | 2.00 | ... | 1.00 | 1.00 | ||||||||||||||||
| Togo | kt | 59.0 | 61.0 | 63.0 | 65.0 | 64.0 |
 Helgi Library


