
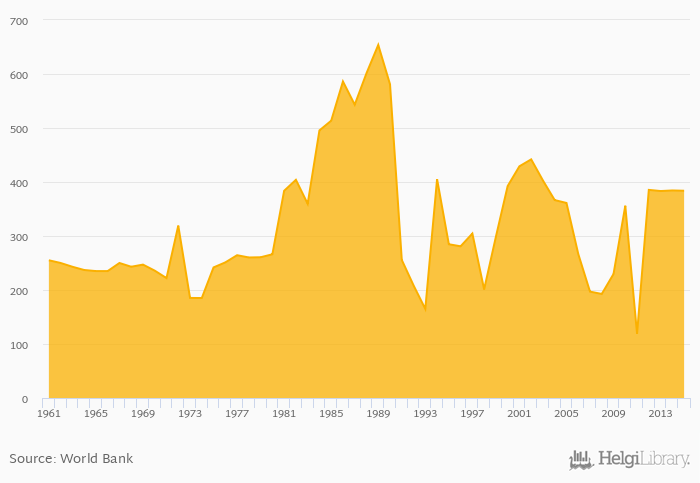
Cereal production fell 0.137% to 384 kt in Somalia in 2015, according to Faostat.
Historically, cereal production in Somalia reached an all time high of 654 kt in 1989 and an all time low of 119 kt in 2011. When compared to Somalia's main peers, cereal production in Djibouti amounted to 0.016 kt, 21,943 kt in Ethiopia, 4,351 kt in Kenya and 875 kt in Yemen in 2015.
Somalia has been ranked 123rd within the group of 164 countries we follow in terms of cereal production, 1 place below the position seen 10 years ago.
| Cereal Production | Unit | 1995 | 1996 | 1997 | 1998 | 1999 | 2000 | 2001 | 2002 | 2003 | 2004 | 2005 | 2006 | 2007 | 2008 | 2009 | 2010 | 2011 | 2012 | 2013 | 2014 | 2015 |
| Djibouti | kt | 0.011 | 0.013 | 0.014 | 0.016 | 0.016 | ||||||||||||||||
| Eritrea | kt | 227 | 244 | 258 | 275 | 265 | ||||||||||||||||
| Ethiopia | kt | 15,534 | 17,761 | 18,810 | 19,651 | 22,707 | ||||||||||||||||
| Kenya | kt | 2,899 | 4,347 | 4,058 | 4,483 | 4,307 | ||||||||||||||||
| Oman | kt | 47.0 | 31.7 | 42.5 | 46.3 | 48.0 | ||||||||||||||||
| Saudi Arabia | kt | 1,586 | 1,565 | 1,414 | 1,150 | 973 | ||||||||||||||||
| Somalia | kt | 230 | 356 | 119 | 385 | 383 | ||||||||||||||||
| Sudan | kt | 5,552 | 3,562 | 5,598 | 2,660 | 5,947 | ||||||||||||||||
| Tanzania | kt | 5,807 | 8,643 | 7,955 | 8,120 | 8,867 | ||||||||||||||||
| Uganda | kt | 3,204 | 3,270 | 3,536 | 3,546 | 3,509 | ||||||||||||||||
| Yemen | kt | 674 | 1,013 | 817 | 910 | 863 |
 Helgi Library


