
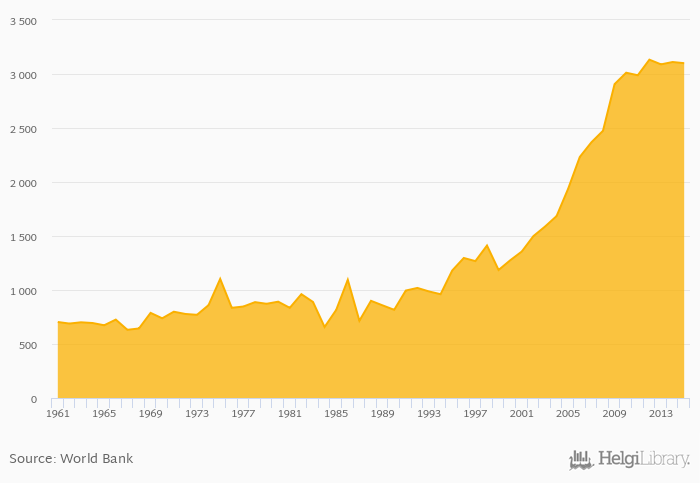
Cereal production fell 0.351% to 3,100 kt in Cameroon in 2015, according to Faostat.
Historically, cereal production in Cameroon reached an all time high of 3,133 kt in 2012 and an all time low of 631 kt in 1967. When compared to Cameroon's main peers, cereal production in Central African Republic amounted to 265 kt, 2,711 kt in Chad, 46.5 kt in Gabon and 25,586 kt in Nigeria in 2015.
Cameroon has been ranked 73rd within the group of 164 countries we follow in terms of cereal production, 9 places above the position seen 10 years ago.
| Cereal Production | Unit | 1995 | 1996 | 1997 | 1998 | 1999 | 2000 | 2001 | 2002 | 2003 | 2004 | 2005 | 2006 | 2007 | 2008 | 2009 | 2010 | 2011 | 2012 | 2013 | 2014 | 2015 |
| Angola | kt | 1,057 | 1,182 | 1,413 | 510 | 1,675 | ||||||||||||||||
| Benin | kt | 1,348 | 1,333 | 1,544 | 1,534 | 1,692 | ||||||||||||||||
| Cameroon | kt | 2,906 | 3,012 | 2,988 | 3,133 | 3,089 | ||||||||||||||||
| Central African Republic | kt | 251 | 249 | 259 | 261 | 266 | ||||||||||||||||
| Chad | kt | 2,088 | 2,150 | 1,553 | 3,162 | 2,561 | ||||||||||||||||
| Congo | kt | 23.9 | 25.0 | 27.1 | 29.0 | 31.7 | ||||||||||||||||
| Dem. Republic of the Congo | kt | 1,527 | 1,528 | 1,529 | 1,790 | 1,794 | ||||||||||||||||
| Equatorial Guinea | kt | ... | ... | ... | ... | ... | ... | ... | ... | ... | ... | ... | ... | ... | ... | ... | ... | ... | ... | ... | ... | ... |
| Gabon | kt | 41.4 | 43.0 | 45.2 | 45.7 | 46.7 | ||||||||||||||||
| Niger | kt | 3,451 | 5,203 | 3,762 | 5,319 | 4,347 | ||||||||||||||||
| Nigeria | kt | 21,268 | 24,656 | 20,703 | 21,436 | 26,970 | ||||||||||||||||
| Sudan | kt | 5,552 | 3,562 | 5,598 | 2,660 | 5,947 |
 Helgi Library


