
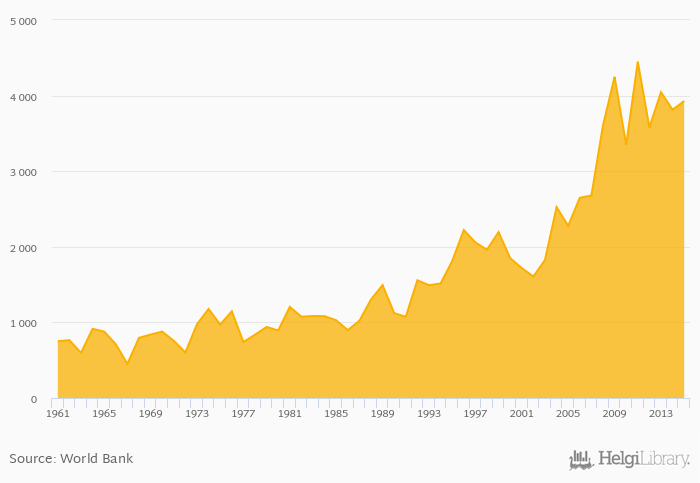
Cereal production rose 3.05% to 3,929 kt in Uruguay in 2015, according to Faostat.
Historically, cereal production in Uruguay reached an all time high of 4,448 kt in 2011 and an all time low of 451 kt in 1967. When compared to Uruguay's main peers, cereal production in Argentina amounted to 49,692 kt, 98,153 kt in Brazil, 3,869 kt in Chile and 5,994 kt in Paraguay in 2015.
Uruguay has been ranked 65th within the group of 164 countries we follow in terms of cereal production, 12 places above the position seen 10 years ago.
| Cereal Production | Unit | 1995 | 1996 | 1997 | 1998 | 1999 | 2000 | 2001 | 2002 | 2003 | 2004 | 2005 | 2006 | 2007 | 2008 | 2009 | 2010 | 2011 | 2012 | 2013 | 2014 | 2015 |
| Argentina | kt | 26,538 | 47,144 | 49,098 | 43,389 | 51,793 | ||||||||||||||||
| Bolivia | kt | 2,379 | 2,134 | 1,988 | 2,160 | 2,230 | ||||||||||||||||
| Brazil | kt | 70,914 | 75,161 | 77,586 | 89,908 | 100,902 | ||||||||||||||||
| Chile | kt | 3,105 | 3,588 | 3,950 | 3,465 | 4,004 | ||||||||||||||||
| Paraguay | kt | 3,166 | 4,976 | 5,368 | 5,161 | 6,272 | ||||||||||||||||
| Peru | kt | 5,050 | 4,868 | 4,619 | 5,224 | 5,249 | ||||||||||||||||
| Uruguay | kt | 4,248 | 3,349 | 4,448 | 3,580 | 4,045 | ||||||||||||||||
| Venezuela | kt | 3,604 | 2,995 | 3,010 | 2,957 | 3,654 |
 Helgi Library


