
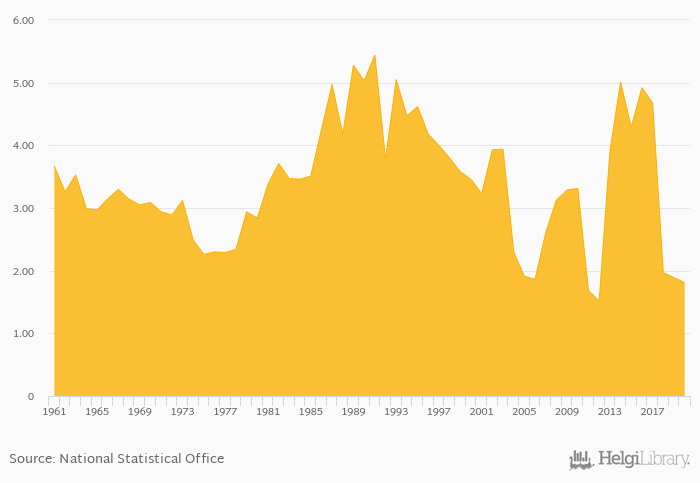
Coconut consumption per capita fell 4.23% to 1.81 kg in Suriname in 2020, according to Faostat.
Historically, coconut consumption per capita in Suriname reached an all time high of 5.44 kg in 1991 and an all time low of 1.52 kg in 2012. When compared to Suriname's main peers, coconut consumption per capita in Brazil amounted to 10.2 kg, 1.94 kg in Guyana, 6.86 kg in Trinidad and Tobago and 0.520 kg in Venezuela in 2020.
Suriname has been ranked 29th within the group of 148 countries we follow in terms of coconut consumption per capita, 2 places below the position seen 10 years ago.
| Coconut Consumption Per Capita | Unit | 2001 | 2002 | 2003 | 2004 | 2005 | 2006 | 2007 | 2008 | 2009 | 2010 | 2011 | 2012 | 2013 | 2014 | 2015 | 2016 | 2017 | 2018 | 2019 | 2020 | 2021 |
| Bolivia | kg | 0.220 | 0.200 | 0.110 | 0.290 | 0.200 | ||||||||||||||||
| Brazil | kg | 12.1 | 11.8 | 9.86 | 10.5 | 10.1 | ||||||||||||||||
| Colombia | kg | 2.66 | 2.70 | 2.82 | 2.74 | 2.75 | ||||||||||||||||
| Guyana | kg | 2.51 | 1.58 | 29.9 | 0.740 | 1.89 | ||||||||||||||||
| Peru | kg | 1.02 | 0.930 | 0.970 | 1.00 | 0.960 | ||||||||||||||||
| Puerto Rico | kg | ... | ... | ... | ... | ... | ... | ... | ... | ... | ... | ... | ... | ... | ... | ... | ... | ... | ... | ... | ... | ... |
| Suriname | kg | 4.17 | 4.78 | 4.54 | 1.91 | 1.83 | ||||||||||||||||
| Trinidad and Tobago | kg | 5.53 | 5.31 | 5.63 | 5.11 | 4.95 | ||||||||||||||||
| Venezuela | kg | 0.480 | 0.580 | 0.740 | 0.600 | 0.450 |
 Helgi Library


