
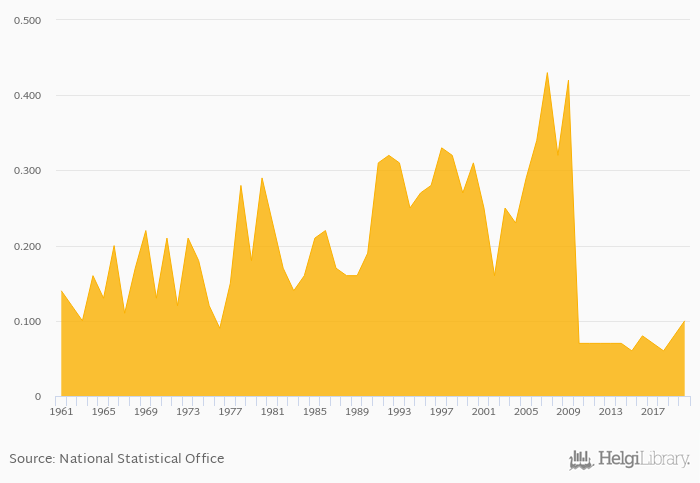
Coconut consumption per capita rose 25.0% to 0.100 kg in Argentina in 2020, according to Faostat.
Historically, coconut consumption per capita in Argentina reached an all time high of 0.430 kg in 2007 and an all time low of 0.060 kg in 2015. When compared to Argentina's main peers, coconut consumption per capita in Bolivia amounted to 0.140 kg, 0.130 kg in Chile, 0.040 kg in Paraguay and 1.03 kg in Uruguay in 2020.
Argentina has been ranked 104th within the group of 148 countries we follow in terms of coconut consumption per capita, 6 places above the position seen 10 years ago.
| Coconut Consumption Per Capita | Unit | 2001 | 2002 | 2003 | 2004 | 2005 | 2006 | 2007 | 2008 | 2009 | 2010 | 2011 | 2012 | 2013 | 2014 | 2015 | 2016 | 2017 | 2018 | 2019 | 2020 | 2021 |
| Argentina | kg | 0.300 | 0.370 | 0.350 | 0.300 | 0.380 | ||||||||||||||||
| Bolivia | kg | 0.220 | 0.200 | 0.110 | 0.290 | 0.200 | ||||||||||||||||
| Brazil | kg | 12.1 | 11.8 | 9.86 | 10.5 | 10.1 | ||||||||||||||||
| Chile | kg | 0.430 | 0.510 | 0.480 | 0.560 | 0.450 | ||||||||||||||||
| Paraguay | kg | 0.050 | 0.070 | 0.070 | 0.060 | 0.070 | ||||||||||||||||
| Peru | kg | 1.02 | 0.930 | 0.970 | 1.00 | 0.960 | ||||||||||||||||
| Uruguay | kg | 0.230 | 0.230 | 0.370 | 1.07 | 0.900 |
 Helgi Library


