
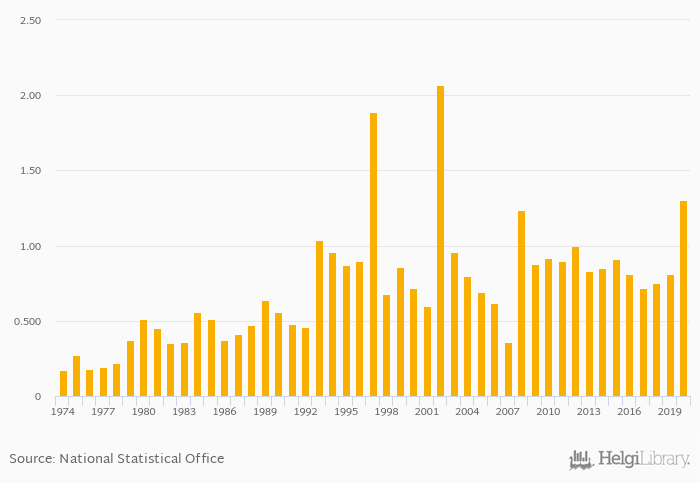
Coffee consumption per capita rose 60.5% to 1.30 kg in Botswana in 2020, according to Faostat.
Historically, coffee consumption per capita in Botswana reached an all time high of 2.07 kg in 2002 and an all time low of 0.170 kg in 1974. When compared to Botswana's main peers, coffee consumption per capita in Namibia amounted to 0.590 kg, 0.930 kg in South Africa, 0.160 kg in Zambia and 0.070 kg in Zimbabwe in 2020.
Botswana has been ranked 80th within the group of 161 countries we follow in terms of coffee consumption per capita, 7 places above the position seen 10 years ago.
| Coffee Consumption Per Capita | Unit | 2001 | 2002 | 2003 | 2004 | 2005 | 2006 | 2007 | 2008 | 2009 | 2010 | 2011 | 2012 | 2013 | 2014 | 2015 | 2016 | 2017 | 2018 | 2019 | 2020 | 2021 |
| Angola | kg | 0.690 | 0.650 | 0.580 | 0.570 | 0.540 | ||||||||||||||||
| Botswana | kg | 1.38 | 1.10 | 1.08 | 1.17 | 1.14 | ||||||||||||||||
| Dem. Republic of the Congo | kg | ... | ... | ... | ... | ... | ... | ... | ... | ... | 0.010 | 0.020 | 0.020 | 0.020 | 0.020 | |||||||
| Lesotho | kg | 0.130 | 0.260 | 2.45 | 0.380 | 0.640 | ||||||||||||||||
| Mozambique | kg | 0.080 | 0.080 | 0.090 | 0.080 | 0.060 | ||||||||||||||||
| Namibia | kg | 1.73 | 1.55 | 1.50 | 1.71 | 3.15 | ||||||||||||||||
| South Africa | kg | 1.00 | 1.01 | 1.02 | 1.02 | 0.940 | ||||||||||||||||
| Swaziland | kg | 1.21 | 0.640 | 0.740 | 0.630 | 0.610 | ||||||||||||||||
| Tanzania | kg | 0.010 | 0.070 | 0.090 | ... | ... | ||||||||||||||||
| Zambia | kg | 0.420 | 0.420 | 0.170 | 0.100 | 0.220 | ||||||||||||||||
| Zimbabwe | kg | 0.130 | 0.100 | 0.120 | 0.070 | 0.070 |
 Helgi Library


