
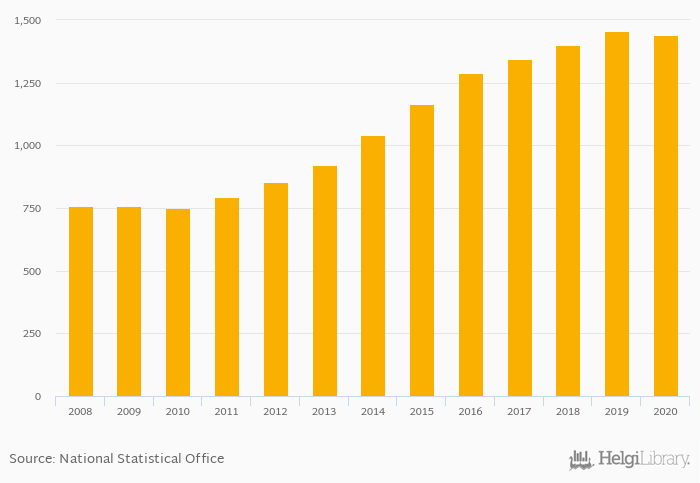
Corporate loans fell 1.21% to ZAR 1,440 bil in South Africa in 2020, according to the National Central Bank.
Historically, corporate loans in South Africa reached an all time high of ZAR 1,458 bil in 2019 and an all time low of ZAR 748 bil in 2010.
South Africa has been ranked 28th within the group of 77 countries we follow in terms of corporate loans, 8 places above the position seen 10 years ago.
| Corporate Loans (Local Currency) | Unit | 2000 | 2001 | 2002 | 2003 | 2004 | 2005 | 2006 | 2007 | 2008 | 2009 | 2010 | 2011 | 2012 | 2013 | 2014 | 2015 | 2016 | 2017 | 2018 | 2019 | 2020 |
| Angola | AOA bil | ... | ... | ... | ... | ... | ... | ... | ... | ... | ... | 3,274 | 3,644 | 3,277 | 3,238 | 3,645 | ... | ... | ||||
| Botswana | BWP bil | ... | ... | ... | ... | ... | ... | ... | ... | ... | ... | ... | ... | ... | ... | 15.8 | 15.0 | 15.0 | 15.6 | 16.6 | ||
| Lesotho | LSL bil | ... | ... | ... | ... | ... | ... | ... | ... | ... | 2.02 | 2.13 | 1.97 | 2.24 | 2.11 | |||||||
| Mozambique | MZN bil | ... | ... | ... | ... | ... | ... | ... | ... | ... | ... | ... | ... | ... | ... | ... | ... | ... | ... | ... | ... | ... |
| Namibia | NAD bil | ... | ... | ... | ... | ... | ... | ... | ... | ... | ... | ... | 33.6 | 38.0 | 38.8 | 40.9 | 39.4 | |||||
| South Africa | ZAR bil | ... | ... | ... | ... | ... | ... | ... | ... | 1,041 | 1,165 | 1,287 | 1,346 | 1,398 | ||||||||
| Swaziland | SZL bil | ... | ... | ... | ... | ... | ... | ... | ... | ... | 5.18 | 4.32 | 5.32 | 5.96 | 6.93 | ... | ||||||
| Zambia | ZMW bil | ... | ... | ... | ... | ... | ... | ... | ... | ... | ... | 11.8 | 16.7 | 15.1 | 15.5 | 17.8 | ||||||
| Zimbabwe | ZWD bil | ... | ... | ... | ... | ... | ... | ... | ... | ... | ... | ... | ... | ... | ... | ... | ... | ... | ... | ... | ... | ... |
 Helgi Library


