
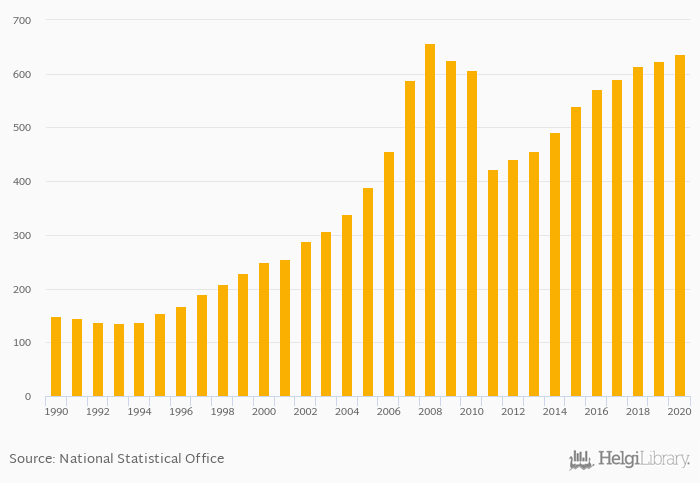
Corporate loans rose 1.88% to AUD 636 bil in Australia in 2020, according to the National Central Bank.
Historically, corporate loans in Australia reached an all time high of AUD 657 bil in 2008 and an all time low of AUD 137 bil in 1993.
Australia has been ranked 38th within the group of 77 countries we follow in terms of corporate loans.
| Corporate Loans (Local Currency) | Unit | 2000 | 2001 | 2002 | 2003 | 2004 | 2005 | 2006 | 2007 | 2008 | 2009 | 2010 | 2011 | 2012 | 2013 | 2014 | 2015 | 2016 | 2017 | 2018 | 2019 | 2020 |
| Australia | AUD bil | 492 | 539 | 572 | 591 | 614 | ||||||||||||||||
| Cambodia | KHR bil | ... | ... | ... | ... | ... | ... | ... | ... | ... | ... | 33,852 | 42,125 | 48,309 | 59,646 | 70,344 | ||||||
| Indonesia | IDR bil | ... | ... | ... | ... | ... | 1,758,300 | 1,987,253 | 2,103,029 | 2,258,672 | 2,651,252 | |||||||||||
| Malaysia | MYR bil | ... | ... | ... | ... | ... | 492 | 531 | 557 | 567 | 604 | |||||||||||
| New Zealand | NZD bil | ... | ... | ... | ... | ... | ... | ... | ... | ... | ... | ... | ... | ... | ... | ... | ... | ... | ... | ... | ... | ... |
| Papua New Guinea | PGK bil | ... | ... | ... | ... | ... | ... | ... | ... | 10.8 | 12.7 | 13.7 | 11.2 | 11.8 | ||||||||
| Philippines | PHP bil | ... | ... | ... | ... | ... | ... | ... | ... | ... | 2,458 | 2,848 | 3,385 | 4,079 | 4,641 | |||||||
| Singapore | SGD bil | ... | ... | ... | ... | ... | ... | ... | ... | ... | ... | ... | ||||||||||
| Thailand | THB bil | ... | ... | ... | ... | ... | ... | 4,709 | 4,978 | 5,153 | 5,359 | 5,644 | ||||||||||
| Vietnam | VND bil | ... | ... | ... | ... | ... | ... | ... | ... | 3,340,394 | 4,021,652 | 4,837,018 | 5,785,712 | 6,598,323 | ... |
 Helgi Library


