
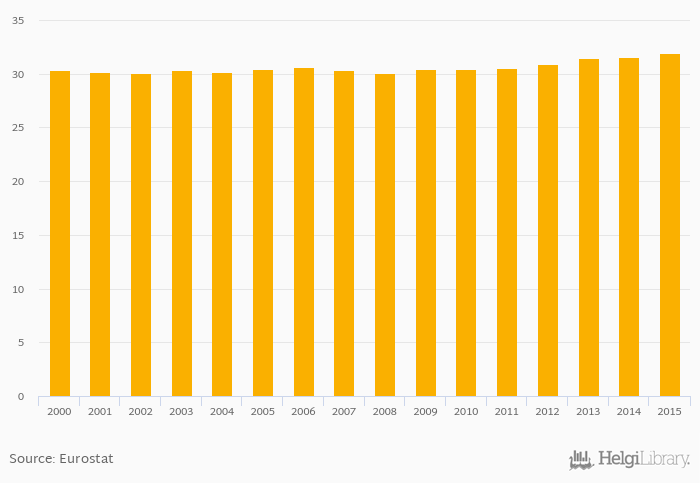
Duration of Working Life (Females) rose 0.949% to 31.9 years in the Czech Republic in 2015, according to Eurostat.
Historically, Duration of Working Life (Females) in the Czech Republic reached an all time high of 31.9 years in 2015 and an all time low of 30.1 years in 2008. When compared to Czech Republic's main peers, Duration of Working Life (Females) in Austria amounted to 34.5 years, 30.0 years in Hungary, 29.9 years in Poland and 30.9 years in Slovakia in 2015.
Czech Republic has been ranked 18th within the group of 31 countries we follow in terms of Duration of Working Life (Females), 2 places below the position seen 10 years ago.
| Duration of Working Life (Females) | Unit | 1995 | 1996 | 1997 | 1998 | 1999 | 2000 | 2001 | 2002 | 2003 | 2004 | 2005 | 2006 | 2007 | 2008 | 2009 | 2010 | 2011 | 2012 | 2013 | 2014 | 2015 |
| Austria | years | ... | ... | ... | ... | ... | 33.3 | 33.4 | 33.7 | 34.1 | 34.3 | |||||||||||
| Czechia | years | ... | ... | ... | ... | ... | 30.4 | 30.4 | 30.5 | 30.9 | 31.5 | |||||||||||
| Germany | years | ... | ... | ... | ... | ... | 33.8 | 34.1 | 34.8 | 34.9 | 35.4 | |||||||||||
| Hungary | years | ... | ... | ... | ... | ... | 26.4 | 27.1 | 27.4 | 28.2 | 28.4 | |||||||||||
| Italy | years | ... | ... | ... | ... | ... | 24.2 | 24.2 | 24.4 | 25.4 | 25.4 | |||||||||||
| Poland | years | ... | ... | ... | ... | ... | 28.3 | 29.0 | 29.1 | 29.5 | 29.6 | |||||||||||
| Russia | years | ... | ... | ... | ... | ... | ... | ... | ... | ... | ... | ... | ... | ... | ... | ... | ... | ... | ... | ... | ... | ... |
| Slovakia | years | ... | ... | ... | ... | ... | 29.1 | 29.5 | 29.4 | 29.7 | 30.0 | |||||||||||
| Switzerland | years | ... | ... | ... | ... | ... | 38.6 | 38.2 | 38.5 | 38.7 | 39.1 | |||||||||||
| Ukraine | years | ... | ... | ... | ... | ... | ... | ... | ... | ... | ... | ... | ... | ... | ... | ... | ... | ... | ... | ... | ... | ... |
 Helgi Library


