
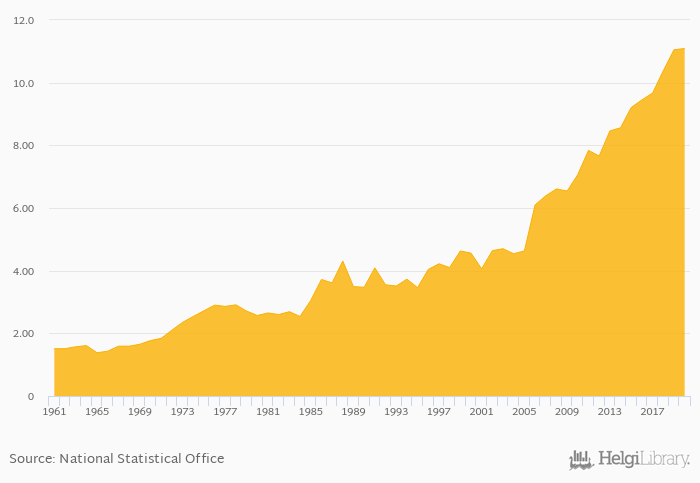
Egg consumption per capita rose 0.362% to 11.1 kg in Peru in 2020, according to Faostat.
Historically, egg consumption per capita in Peru reached an all time high of 11.1 kg in 2020 and an all time low of 1.38 kg in 1965. When compared to Peru's main peers, egg consumption per capita in Bolivia amounted to 7.30 kg, 12.8 kg in Brazil, 9.64 kg in Chile and 14.9 kg in Colombia in 2020.
Peru has been ranked 47th within the group of 165 countries we follow in terms of egg consumption per capita, 26 places above the position seen 10 years ago.
| Egg Consumption Per Capita | Unit | 2001 | 2002 | 2003 | 2004 | 2005 | 2006 | 2007 | 2008 | 2009 | 2010 | 2011 | 2012 | 2013 | 2014 | 2015 | 2016 | 2017 | 2018 | 2019 | 2020 | 2021 |
| Argentina | kg | 15.0 | 15.6 | 15.7 | 16.1 | 15.9 | ||||||||||||||||
| Bolivia | kg | 5.96 | 6.01 | 7.49 | 7.25 | 7.22 | ||||||||||||||||
| Brazil | kg | 9.58 | 9.43 | 10.3 | 12.1 | 12.5 | ||||||||||||||||
| Chile | kg | 10.4 | 10.5 | 10.2 | 11.0 | 9.59 | ||||||||||||||||
| Colombia | kg | 12.0 | 12.5 | 13.3 | 13.7 | 13.3 | ||||||||||||||||
| Paraguay | kg | 16.7 | 17.0 | 21.4 | 20.1 | 17.8 | ||||||||||||||||
| Peru | kg | 9.14 | 9.38 | 9.62 | 10.3 | 10.9 | ||||||||||||||||
| Uruguay | kg | 11.0 | 11.5 | 12.0 | 12.0 | 13.8 | ||||||||||||||||
| Venezuela | kg | 5.90 | 4.41 | 4.19 | 5.14 | 5.98 |
 Helgi Library


