
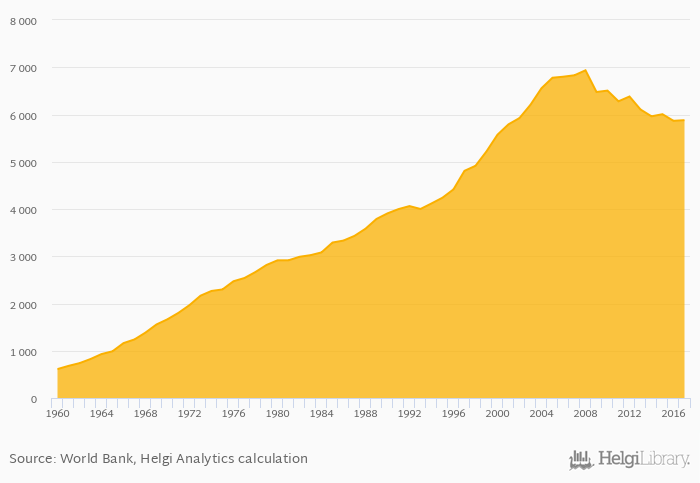
Electric power production per capita rose 0.240% to 5,880 kWh in Spain in 2017, according to World Bank / EIA.
Historically, electric power production per capita in Spain reached an all time high of 6,935 kWh in 2008 and an all time low of 612 kWh in 1960. When compared to Spain's main peers, electric power production per capita in France amounted to 8,544 kWh, 4,879 kWh in Italy, 923 kWh in Morocco and 5,737 kWh in Portugal in 2017.
Spain has been ranked 33rd within the group of 79 countries we follow in terms of electric power production per capita, 2 places below the position seen 10 years ago.
| Electric Power Production Per Capita | Unit | 1997 | 1998 | 1999 | 2000 | 2001 | 2002 | 2003 | 2004 | 2005 | 2006 | 2007 | 2008 | 2009 | 2010 | 2011 | 2012 | 2013 | 2014 | 2015 | 2016 | 2017 |
| Algeria | kWh | 1,407 | 1,496 | 1,535 | 1,621 | 1,710 | ||||||||||||||||
| Austria | kWh | 7,817 | 8,573 | 8,041 | 7,682 | 7,651 | ||||||||||||||||
| Belgium | kWh | 8,206 | 7,514 | 7,548 | 6,559 | 6,295 | ||||||||||||||||
| France | kWh | 8,894 | 8,848 | 8,960 | 8,777 | 8,844 | ||||||||||||||||
| Germany | kWh | 7,402 | 7,627 | 7,750 | 7,624 | 7,894 | ||||||||||||||||
| Ireland | kWh | 6,083 | 6,050 | 5,678 | 5,667 | 6,063 | ||||||||||||||||
| Italy | kWh | 4,975 | 5,032 | 4,768 | 4,602 | 4,665 | ||||||||||||||||
| Mauritania | kWh | ... | ... | ... | ... | ... | ... | ... | ... | ... | ... | ... | ... | ... | ... | ... | ... | ... | ... | ... | ... | ... |
| Morocco | kWh | 792 | 853 | 856 | 881 | 902 | ||||||||||||||||
| Portugal | kWh | 4,956 | 4,407 | 4,891 | 5,007 | 4,982 | ||||||||||||||||
| Slovenia | kWh | 7,796 | 7,629 | 7,804 | 8,453 | 7,324 | ||||||||||||||||
| Spain | kWh | 6,279 | 6,381 | 6,106 | 5,961 | 6,006 | ||||||||||||||||
| Switzerland | kWh | 8,371 | 8,974 | 8,939 | 9,040 | 8,497 | ||||||||||||||||
| Tunisia | kWh | 1,502 | ... | ... | ... | ... | ... | ... |
 Helgi Library


