
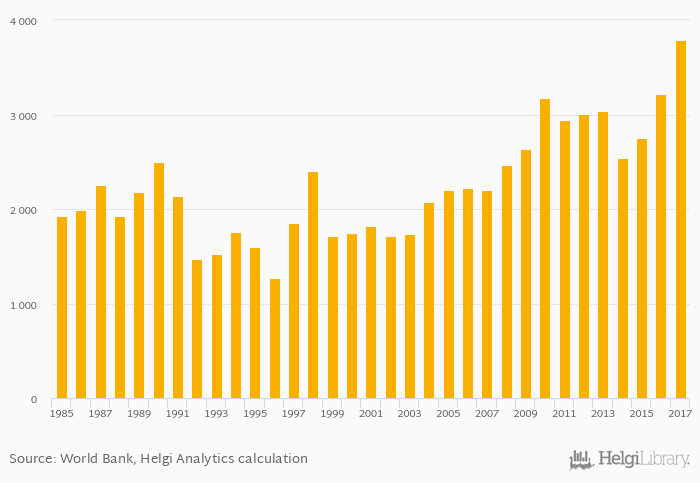
Electric power production per capita rose 17.9% to 3,791 kWh in Latvia in 2017, according to World Bank / EIA.
Historically, electric power production per capita in Latvia reached an all time high of 3,791 kWh in 2017 and an all time low of 1,272 kWh in 1996. When compared to Latvia's main peers, electric power production per capita in Belarus amounted to 3,802 kWh, 10,702 kWh in Estonia, 1,419 kWh in Lithuania and 7,837 kWh in Russia in 2017.
Latvia has been ranked 52nd within the group of 79 countries we follow in terms of electric power production per capita, 24 places above the position seen 10 years ago.
| Electric Power Production Per Capita | Unit | 1997 | 1998 | 1999 | 2000 | 2001 | 2002 | 2003 | 2004 | 2005 | 2006 | 2007 | 2008 | 2009 | 2010 | 2011 | 2012 | 2013 | 2014 | 2015 | 2016 | 2017 |
| Belarus | kWh | 3,411 | 3,283 | 3,382 | 3,758 | 3,732 | ||||||||||||||||
| China | kWh | 3,448 | 3,632 | 3,940 | 4,083 | 4,190 | ||||||||||||||||
| Estonia | kWh | 9,969 | 9,293 | 10,356 | 9,744 | 8,207 | ||||||||||||||||
| Finland | kWh | 13,688 | 13,059 | 13,210 | 12,602 | 12,694 | ||||||||||||||||
| Germany | kWh | 7,402 | 7,627 | 7,750 | 7,624 | 7,894 | ||||||||||||||||
| Japan | kWh | 8,680 | 8,717 | 8,587 | 8,414 | 8,183 | ||||||||||||||||
| Latvia | kWh | 2,942 | 3,000 | 3,041 | 2,535 | 2,748 | ||||||||||||||||
| Lithuania | kWh | 1,586 | 1,670 | 1,586 | 1,472 | 1,660 | ||||||||||||||||
| Poland | kWh | 4,286 | 4,255 | 4,326 | 4,191 | 4,357 | ||||||||||||||||
| Russia | kWh | 7,363 | 7,489 | 7,451 | 7,523 | 7,586 | ||||||||||||||||
| USA | kWh | 13,869 | 13,608 | 13,586 | 13,608 | 13,485 | ||||||||||||||||
| Ukraine | kWh | 4,261 | 4,380 | 4,317 | 4,096 | 3,701 |
 Helgi Library


