
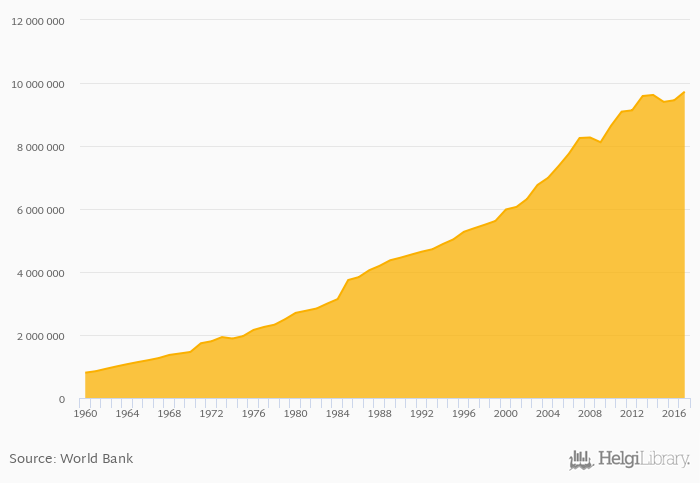
Electricity production from coal sources rose 2.88% to 9,723,438 GWh in the World in 2017, according to World Bank / EIA.
Historically, electricity production from coal sources in the World reached an all time high of 9,723,438 GWh in 2017 and an all time low of 803,767 GWh in 1960. When compared to World's main peers, electricity production from coal sources in China amounted to 4,360,863 GWh, 242,200 GWh in Germany, 342,459 GWh in Japan and 1,314,043 GWh in USA in 2017.
World has been ranked th within the group of 27 countries we follow in terms of electricity production from coal sources.
| Electricity Production from Coal Sources | Unit | 1997 | 1998 | 1999 | 2000 | 2001 | 2002 | 2003 | 2004 | 2005 | 2006 | 2007 | 2008 | 2009 | 2010 | 2011 | 2012 | 2013 | 2014 | 2015 | 2016 | 2017 |
| Austria | GWh | 7,311 | ... | ... | ... | ... | ... | ... | ||||||||||||||
| Belgium | GWh | 5,460 | ... | ... | ... | ... | ... | ... | ||||||||||||||
| Canada | GWh | 77,623 | 67,490 | 68,593 | 68,451 | 68,097 | ||||||||||||||||
| China | GWh | 3,695,410 | 3,755,839 | 4,074,171 | 4,070,941 | 4,042,505 | ||||||||||||||||
| France | GWh | 22,611 | ... | ... | ... | ... | ... | ... | ||||||||||||||
| Germany | GWh | 262,470 | 277,127 | 288,206 | 274,410 | 272,200 | ||||||||||||||||
| India | GWh | 701,255 | 787,130 | 847,969 | 949,931 | 1,006,555 | ||||||||||||||||
| Japan | GWh | 281,577 | 330,798 | 359,246 | 353,086 | 346,687 | ||||||||||||||||
| Mexico | GWh | 33,782 | 34,233 | 31,738 | 33,778 | 33,764 | ||||||||||||||||
| Poland | GWh | 141,571 | 136,416 | 139,758 | 131,551 | 132,962 | ||||||||||||||||
| Russia | GWh | 165,011 | 169,163 | 161,872 | 158,702 | 158,552 | ||||||||||||||||
| South Korea | GWh | 227,517 | 228,168 | 228,967 | 217,183 | 225,726 | ||||||||||||||||
| USA | GWh | 1,876,340 | 1,640,796 | 1,713,944 | 1,713,690 | 1,468,296 | ||||||||||||||||
| World | GWh | 9,090,848 | 9,131,524 | 9,586,612 | 9,620,165 | 9,400,117 |
 Helgi Library


