
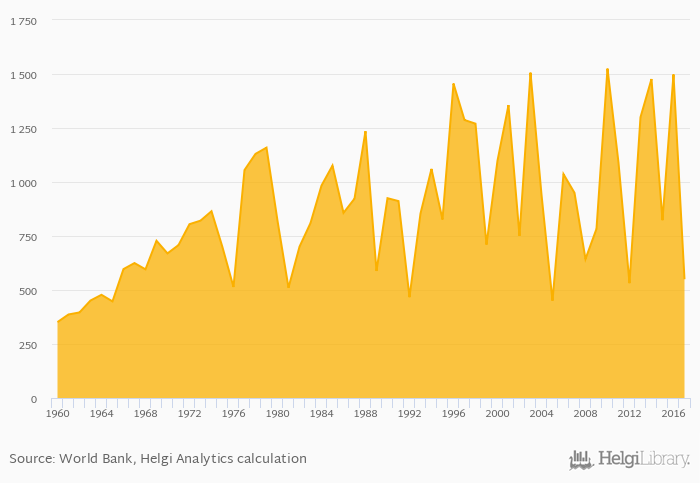
Electricity production from hydro sources per capita fell 63.3% to 550 kWh in Portugal in 2017, according to World Bank / EIA.
Historically, electricity production from hydro sources per capita in Portugal reached an all time high of 1,525 kWh in 2010 and an all time low of 351 kWh in 1960. When compared to Portugal's main peers, electricity production from hydro sources per capita in France amounted to 759 kWh, 146 kWh in Ireland, 34.6 kWh in Morocco and 395 kWh in Spain in 2017.
Portugal has been ranked 32nd within the group of 69 countries we follow in terms of electricity production from hydro sources per capita, 4 places below the position seen 10 years ago.
| Electricity Production from Hydro Sources Per Capita | Unit | 1997 | 1998 | 1999 | 2000 | 2001 | 2002 | 2003 | 2004 | 2005 | 2006 | 2007 | 2008 | 2009 | 2010 | 2011 | 2012 | 2013 | 2014 | 2015 | 2016 | 2017 |
| Algeria | kWh | 10.0 | 10.1 | 2.54 | 4.87 | 3.60 | ||||||||||||||||
| Belgium | kWh | 17.8 | 32.4 | 34.4 | 26.4 | 28.7 | ||||||||||||||||
| Canada | kWh | 10,905 | 10,941 | 11,182 | 10,833 | 10,743 | ||||||||||||||||
| France | kWh | 705 | 920 | 1,104 | 978 | 844 | ||||||||||||||||
| Germany | kWh | 213 | 267 | 279 | 238 | 232 | ||||||||||||||||
| Iceland | kWh | 38,875 | 37,951 | 39,200 | 38,886 | 41,275 | ||||||||||||||||
| Ireland | kWh | 156 | 176 | 130 | 153 | 172 | ||||||||||||||||
| Italy | kWh | 753 | 704 | 868 | 963 | 751 | ||||||||||||||||
| Mauritania | kWh | ... | ... | ... | ... | ... | ... | ... | ... | ... | ... | ... | ... | ... | ... | ... | ... | ... | ... | ... | ... | ... |
| Morocco | kWh | 62.6 | 50.3 | 84.8 | 49.2 | 56.1 | ||||||||||||||||
| Portugal | kWh | 1,090 | 531 | 1,300 | 1,476 | 823 | ||||||||||||||||
| Spain | kWh | 658 | 441 | 787 | 838 | 601 | ||||||||||||||||
| Tunisia | kWh | ... | ... | ... | ... | ... | ... | ... | ||||||||||||||
| United Kingdom | kWh | 91.3 | 84.8 | 74.8 | 93.3 | 99.4 |
 Helgi Library


