
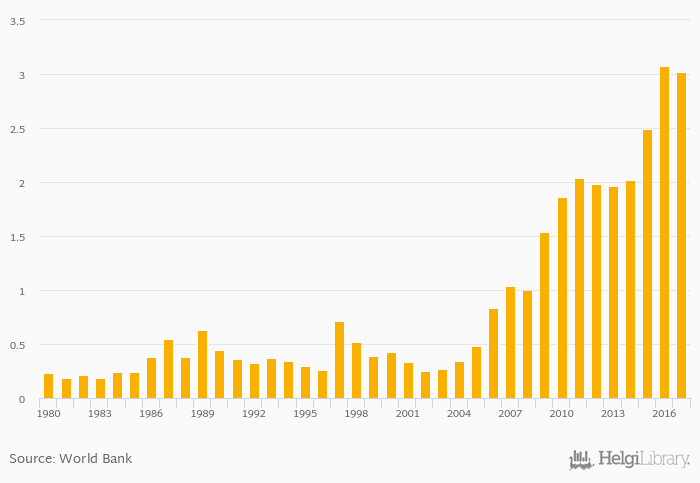
Electricity production from natural gas sources as a percentage of total fell 1.61% to 3.02% in China in 2017, according to World Bank / EIA.
Historically, electricity production from natural gas sources as a percentage of total in China reached an all time high of 3.07% in 2016 and an all time low of 0.182% in 1983. When compared to China's main peers, electricity production from natural gas sources as a percentage of total in India amounted to 5.04%, 39.4% in Japan, 48.6% in Russia and 32.0% in USA in 2017.
China has been ranked 29th within the group of 30 countries we follow in terms of electricity production from natural gas sources as a percentage of total, 65 places above the position seen 10 years ago.
| Electricity Production from Natural Gas Sources (As % of Total) | Unit | 1997 | 1998 | 1999 | 2000 | 2001 | 2002 | 2003 | 2004 | 2005 | 2006 | 2007 | 2008 | 2009 | 2010 | 2011 | 2012 | 2013 | 2014 | 2015 | 2016 | 2017 |
| Bangladesh | % | 86.7% | 84.1% | 83.1% | 82.0% | 80.7% | ... | ... | ||||||||||||||
| Canada | % | 9.69% | 10.2% | 9.80% | 9.60% | 10.0% | ||||||||||||||||
| China | % | 2.04% | 1.98% | 1.96% | 2.02% | 2.49% | ||||||||||||||||
| Germany | % | 14.4% | 12.4% | 10.9% | 10.0% | 9.83% | ||||||||||||||||
| India | % | 10.6% | 7.61% | 5.24% | 4.64% | 4.92% | ||||||||||||||||
| Japan | % | 36.1% | 38.7% | 38.5% | 41.5% | 39.6% | ||||||||||||||||
| Mexico | % | 54.3% | 53.9% | 55.7% | 57.0% | 59.9% | ||||||||||||||||
| Pakistan | % | 29.1% | 28.2% | 25.6% | 26.5% | 25.7% | ... | ... | ||||||||||||||
| Russia | % | 49.3% | 49.1% | 50.1% | 50.2% | 49.7% | ||||||||||||||||
| South Korea | % | 22.3% | 21.1% | 26.9% | 23.9% | 22.4% | ||||||||||||||||
| Sri Lanka | % | ... | ... | ... | ... | ... | ... | ... | ... | ... | ... | ... | ... | ... | ... | ... | ... | ... | ... | ... | ... | ... |
| USA | % | 24.2% | 29.6% | 27.0% | 26.9% | 31.9% |
 Helgi Library


