
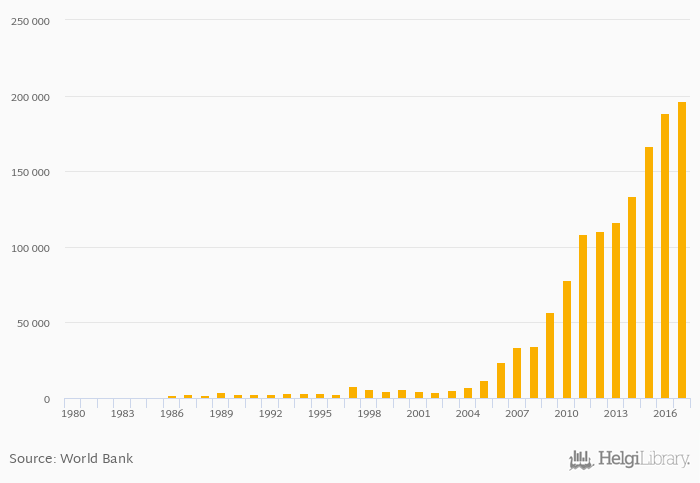
Electricity production from natural gas sources rose 4.20% to 196,188 GWh in China in 2017, according to World Bank / EIA.
Historically, electricity production from natural gas sources in China reached an all time high of 196,188 GWh in 2017 and an all time low of 565 GWh in 1981. When compared to China's main peers, electricity production from natural gas sources in India amounted to 75,476 GWh, 401,450 GWh in Japan, 529,852 GWh in Russia and 1,368,671 GWh in USA in 2017.
China has been ranked 6th within the group of 30 countries we follow in terms of electricity production from natural gas sources, 20 places above the position seen 10 years ago.
| Electricity Production from Natural Gas Sources | Unit | 1997 | 1998 | 1999 | 2000 | 2001 | 2002 | 2003 | 2004 | 2005 | 2006 | 2007 | 2008 | 2009 | 2010 | 2011 | 2012 | 2013 | 2014 | 2015 | 2016 | 2017 |
| Bangladesh | GWh | 40,308 | ... | ... | ... | ... | ... | ... | ||||||||||||||
| Canada | GWh | 60,750 | 61,549 | 58,629 | 56,234 | 70,335 | ||||||||||||||||
| China | GWh | 108,767 | 110,252 | 116,388 | 133,283 | 166,907 | ||||||||||||||||
| Germany | GWh | 86,129 | 76,448 | 67,518 | 61,130 | 62,034 | ||||||||||||||||
| India | GWh | 117,559 | 96,253 | 66,311 | 64,015 | 64,768 | ||||||||||||||||
| Japan | GWh | 375,179 | 430,927 | 419,716 | 447,694 | 413,974 | ||||||||||||||||
| Mexico | GWh | 151,711 | 153,645 | 165,499 | 174,039 | 186,175 | ||||||||||||||||
| Pakistan | GWh | 27,650 | ... | ... | ... | ... | ... | ... | ||||||||||||||
| Russia | GWh | 521,296 | 526,111 | 529,960 | 534,850 | 529,755 | ||||||||||||||||
| South Korea | GWh | 108,588 | 121,458 | 135,261 | 120,872 | 103,009 | ||||||||||||||||
| Sri Lanka | GWh | ... | ... | ... | ... | ... | ... | ... | ... | ... | ... | ... | ... | ... | ... | ... | ... | ... | ... | ... | ... | ... |
| USA | GWh | 1,089,988 | 1,318,166 | 1,209,501 | 1,211,407 | 1,433,852 |
 Helgi Library


