
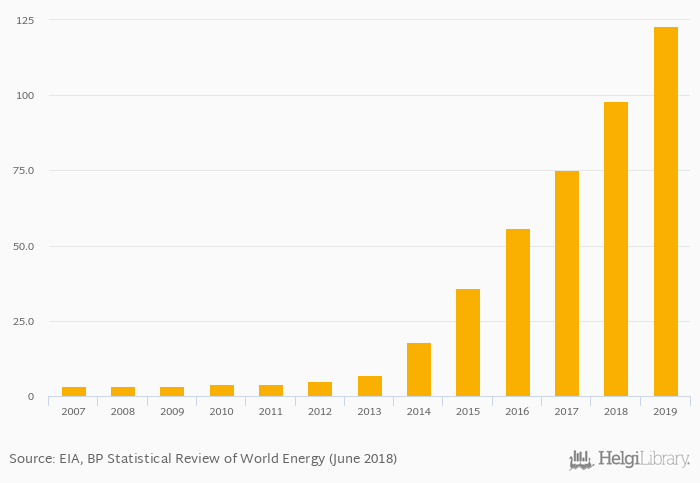
Electricity production from solar photovoltaic rose 25.5% to 123 GWh in New Zealand in 2019, according to World Bank / EIA.
Historically, electricity production from solar photovoltaic in New Zealand reached an all time high of 123 GWh in 2019 and an all time low of 3.41 GWh in 2007. When compared to New Zealand's main peers, electricity production from solar photovoltaic in Australia amounted to 14,218 GWh, 98.0 GWh in Indonesia, 800 GWh in Malaysia and 1,246 GWh in Philippines in 2019.
New Zealand has been ranked 72nd within the group of 160 countries we follow in terms of electricity production from solar photovoltaic, 27 places below the position seen 10 years ago.
| Electricity Production from Solar Photovoltaic | Unit | 1999 | 2000 | 2001 | 2002 | 2003 | 2004 | 2005 | 2006 | 2007 | 2008 | 2009 | 2010 | 2011 | 2012 | 2013 | 2014 | 2015 | 2016 | 2017 | 2018 | 2019 |
| Australia | GWh | 3,476 | 4,010 | 5,023 | 6,209 | 8,071 | ||||||||||||||||
| Cambodia | GWh | ... | 3.00 | 3.00 | 3.00 | 3.00 | 5.00 | |||||||||||||||
| China | GWh | 15,477 | 29,230 | 44,809 | 75,344 | 131,325 | ||||||||||||||||
| Indonesia | GWh | ... | ... | ... | ... | ... | ... | ... | ... | ... | 5.00 | 7.00 | 5.00 | 21.0 | 29.0 | |||||||
| Malaysia | GWh | ... | ... | ... | ... | ... | ... | ... | ... | 140 | 230 | 270 | 310 | 330 | ||||||||
| New Zealand | GWh | ... | ... | ... | ... | ... | ... | ... | ... | 7.00 | 18.0 | 36.0 | 56.0 | 75.0 | ||||||||
| Papua New Guinea | GWh | ... | ... | ... | ... | ... | ... | 0.492 | 0.492 | 1.27 | 1.78 | 1.73 | ||||||||||
| Philippines | GWh | ... | ... | ... | ... | ... | ... | 1.00 | 17.0 | 139 | 1,097 | 1,201 | ||||||||||
| Singapore | GWh | ... | ... | ... | ... | ... | ... | 17.0 | 38.0 | 69.0 | 146 | 175 | ||||||||||
| Taiwan | GWh | 338 | 552 | 876 | 1,132 | 1,692 | ||||||||||||||||
| Thailand | GWh | 1,080 | 1,385 | 2,380 | 3,380 | 4,543 | ||||||||||||||||
| Vietnam | GWh | ... | 6.00 | 7.00 | 7.00 | 7.00 | 9.00 |
 Helgi Library


