
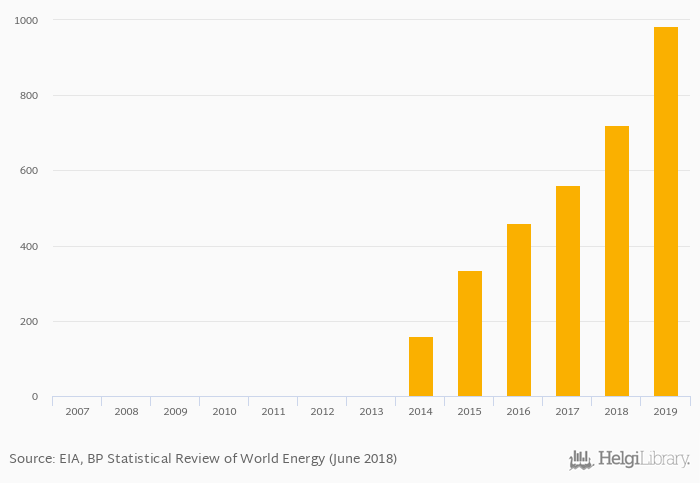
Electricity production from solar photovoltaic rose 36.8% to 985 GWh in Russia in 2019, according to World Bank / EIA.
Historically, electricity production from solar photovoltaic in Russia reached an all time high of 985 GWh in 2019 and an all time low of 0 GWh in 2007. When compared to Russia's main peers, electricity production from solar photovoltaic in China amounted to 224,100 GWh, 44,876 GWh in Germany, 74,522 GWh in Japan and 106,894 GWh in USA in 2019.
Russia has been ranked 40th within the group of 160 countries we follow in terms of electricity production from solar photovoltaic, 47 places above the position seen 10 years ago.
| Electricity Production from Solar Photovoltaic | Unit | 1999 | 2000 | 2001 | 2002 | 2003 | 2004 | 2005 | 2006 | 2007 | 2008 | 2009 | 2010 | 2011 | 2012 | 2013 | 2014 | 2015 | 2016 | 2017 | 2018 | 2019 |
| Austria | GWh | 598 | 747 | 889 | 1,041 | 1,208 | ||||||||||||||||
| Belgium | GWh | ... | ... | ... | ... | ... | 2,624 | 2,865 | 3,034 | 3,073 | 3,284 | |||||||||||
| Canada | GWh | 1,484 | 2,099 | 2,866 | 3,992 | 3,538 | ||||||||||||||||
| China | GWh | 15,477 | 29,230 | 44,809 | 75,344 | 131,325 | ||||||||||||||||
| France | GWh | 5,194 | 6,391 | 7,753 | 8,659 | 9,585 | ||||||||||||||||
| Germany | GWh | 31,010 | 36,056 | 38,726 | 38,098 | 39,401 | ||||||||||||||||
| India | GWh | 4,111 | 5,812 | 10,420 | 18,778 | 26,035 | ||||||||||||||||
| Japan | GWh | 12,879 | 22,952 | 34,803 | 45,761 | 55,069 | ||||||||||||||||
| Mexico | GWh | 106 | 221 | 239 | 464 | 1,074 | ||||||||||||||||
| Poland | GWh | ... | ... | ... | ... | ... | ... | ... | ... | ... | ... | 1.00 | 7.00 | 57.0 | 124 | 165 | ||||||
| Russia | GWh | ... | ... | ... | ... | ... | ... | ... | ... | 1.00 | 160 | 335 | 460 | 560 | ||||||||
| South Korea | GWh | 1,595 | 2,547 | 3,880 | 5,068 | 7,054 | ||||||||||||||||
| USA | GWh | 17,167 | 28,924 | 39,032 | 54,866 | 77,277 |
 Helgi Library


