
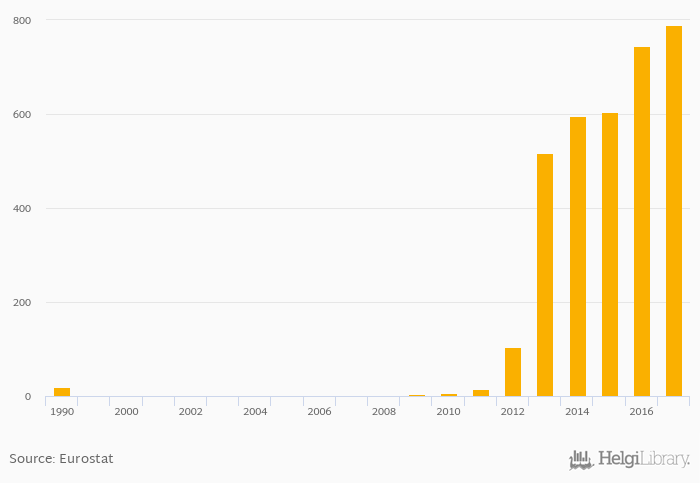
Electricity production from solar photovoltaic rose 6.05% to 789 GWh in Denmark in 2017, according to World Bank / EIA.
Historically, electricity production from solar photovoltaic in Denmark reached an all time high of 789 GWh in 2017 and an all time low of 1.00 GWh in 2000. When compared to Denmark's main peers, electricity production from solar photovoltaic in Germany amounted to 39,895 GWh, 1,883 GWh in Netherlands, 30.8 GWh in Norway and 188 GWh in Sweden in 2017.
Denmark has been ranked 30th within the group of 78 countries we follow in terms of electricity production from solar photovoltaic, 3 places above the position seen 10 years ago.
| Electricity Production from Solar Photovoltaic | Unit | 1999 | 2000 | 2001 | 2002 | 2003 | 2004 | 2005 | 2006 | 2007 | 2008 | 2009 | 2010 | 2011 | 2012 | 2013 | 2014 | 2015 | 2016 | 2017 | 2018 | 2019 |
| Austria | GWh | 598 | 747 | 889 | 1,041 | 1,208 | ||||||||||||||||
| Belgium | GWh | ... | ... | ... | ... | ... | 2,624 | 2,865 | 3,034 | 3,073 | 3,284 | |||||||||||
| Denmark | GWh | 518 | 596 | 604 | 744 | 751 | ||||||||||||||||
| Finland | GWh | 6.00 | 8.00 | 11.0 | 22.0 | 48.0 | ||||||||||||||||
| France | GWh | 5,194 | 6,391 | 7,753 | 8,659 | 9,585 | ||||||||||||||||
| Germany | GWh | 31,010 | 36,056 | 38,726 | 38,098 | 39,401 | ||||||||||||||||
| Iceland | GWh | ... | ... | ... | ... | ... | ... | ... | ... | ... | ... | ... | ... | ... | ... | ... | ... | ... | ... | ... | ... | ... |
| Netherlands | GWh | 410 | 725 | 1,109 | 1,602 | 2,208 | ||||||||||||||||
| Norway | GWh | 9.00 | 10.7 | 12.5 | 18.7 | 30.8 | ||||||||||||||||
| Poland | GWh | ... | ... | ... | ... | ... | ... | ... | ... | ... | ... | 1.00 | 7.00 | 57.0 | 124 | 165 | ||||||
| Russia | GWh | ... | ... | ... | ... | ... | ... | ... | ... | 1.00 | 160 | 335 | 460 | 560 | ||||||||
| Sweden | GWh | 35.0 | 47.0 | 97.0 | 143 | 230 | ||||||||||||||||
| United Kingdom | GWh | 2,010 | 4,054 | 7,533 | 10,408 | 11,475 |
 Helgi Library


