
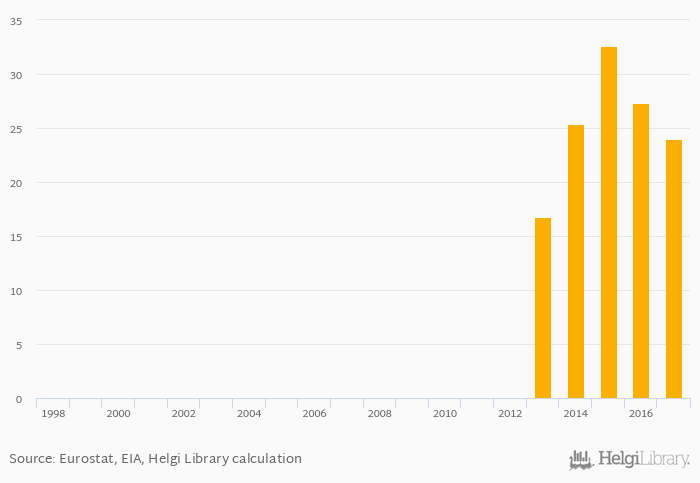
Electricity production from wind power sources per capita fell 12.5% to 23.9 kWh in Iceland in 2017, according to World Bank / EIA.
Historically, electricity production from wind power sources per capita in Iceland reached an all time high of 32.6 kWh in 2015 and an all time low of 0 kWh in 1998. When compared to Iceland's main peers, electricity production from wind power sources per capita in Denmark amounted to 2,620 kWh, 550 kWh in Norway, 1,785 kWh in Sweden and 778 kWh in United Kingdom in 2017.
Iceland has been ranked 44th within the group of 71 countries we follow in terms of electricity production from wind power sources per capita, 30 places above the position seen 10 years ago.
| Electricity Production from Wind Power Sources Per Capita | Unit | 1997 | 1998 | 1999 | 2000 | 2001 | 2002 | 2003 | 2004 | 2005 | 2006 | 2007 | 2008 | 2009 | 2010 | 2011 | 2012 | 2013 | 2014 | 2015 | 2016 | 2017 |
| Belgium | kWh | 210 | 249 | 331 | 417 | 502 | ||||||||||||||||
| Denmark | kWh | 1,755 | 1,839 | 1,987 | 2,332 | 2,515 | ||||||||||||||||
| Finland | kWh | 89.4 | 91.6 | 143 | 205 | 429 | ||||||||||||||||
| France | kWh | 190 | 234 | 250 | 268 | 330 | ||||||||||||||||
| Germany | kWh | 602 | 625 | 640 | 712 | 984 | ||||||||||||||||
| Iceland | kWh | ... | 0.025 | ... | 16.7 | 25.3 | 32.6 | |||||||||||||||
| Ireland | kWh | 970 | 879 | 986 | 1,107 | 1,404 | ||||||||||||||||
| Netherlands | kWh | 306 | 299 | 337 | 347 | 452 | ||||||||||||||||
| Norway | kWh | 260 | 311 | 374 | 438 | 493 | ||||||||||||||||
| Russia | kWh | 0.038 | 0.037 | 0.031 | 0.679 | 1.03 | ||||||||||||||||
| Sweden | kWh | 644 | 755 | 1,032 | 1,173 | 1,691 | ||||||||||||||||
| United Kingdom | kWh | 256 | 317 | 452 | 506 | 637 |
 Helgi Library


