
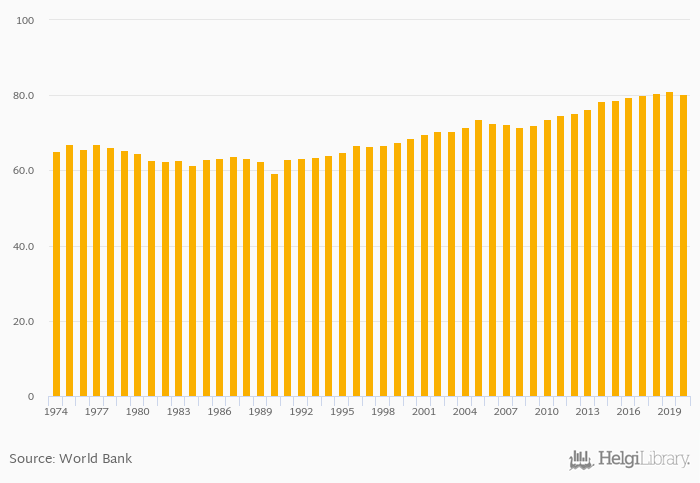
Employees In Services, Male (As % of Male Employment) fell 0.891% to 80.4% in Singapore in 2020, according to World Bank.
Historically, Employees In Services, Male (As % of Male Employment) in Singapore reached an all time high of 81.1% in 2019 and an all time low of 59.2% in 1990. When compared to Singapore's main peers, Employees In Services, Male (As % of Male Employment) in Indonesia amounted to 44.6%, 55.8% in Malaysia, 45.4% in Philippines and 41.4% in Thailand in 2020.
Singapore has been ranked 4th within the group of 173 countries we follow in terms of Employees In Services, Male (As % of Male Employment), 1 place above the position seen 10 years ago.
| Employees In Services, Male (As % of Male Employment) | Unit | 2000 | 2001 | 2002 | 2003 | 2004 | 2005 | 2006 | 2007 | 2008 | 2009 | 2010 | 2011 | 2012 | 2013 | 2014 | 2015 | 2016 | 2017 | 2018 | 2019 | 2020 |
| Australia | % | 65.8% | 67.3% | 67.4% | 67.0% | 66.5% | ||||||||||||||||
| Cambodia | % | 31.3% | 34.0% | 38.1% | 37.3% | 37.2% | ||||||||||||||||
| China | % | 35.3% | 36.8% | 37.9% | 39.2% | 39.8% | ||||||||||||||||
| Indonesia | % | 40.1% | 40.8% | 41.8% | 42.5% | 43.3% | ||||||||||||||||
| Laos | % | 22.6% | 23.0% | 23.3% | 23.6% | 23.8% | ||||||||||||||||
| Malaysia | % | 52.0% | 52.2% | 53.8% | 53.8% | 55.2% | ||||||||||||||||
| Myanmar | % | 28.3% | 28.8% | 29.2% | 29.6% | 30.5% | ||||||||||||||||
| Philippines | % | 43.2% | 43.8% | 44.7% | 44.9% | 44.6% | ||||||||||||||||
| Singapore | % | 78.4% | 78.8% | 79.5% | 80.0% | 80.6% | ||||||||||||||||
| Taiwan | % | ... | ... | ... | ... | ... | ... | ... | ... | ... | ... | ... | ... | ... | ... | ... | ... | ... | ... | ... | ... | ... |
| Thailand | % | 38.7% | 39.5% | 40.2% | 40.7% | 40.2% | ||||||||||||||||
| Vietnam | % | 30.2% | 31.4% | 31.2% | 31.6% | 32.0% |
 Helgi Library


