
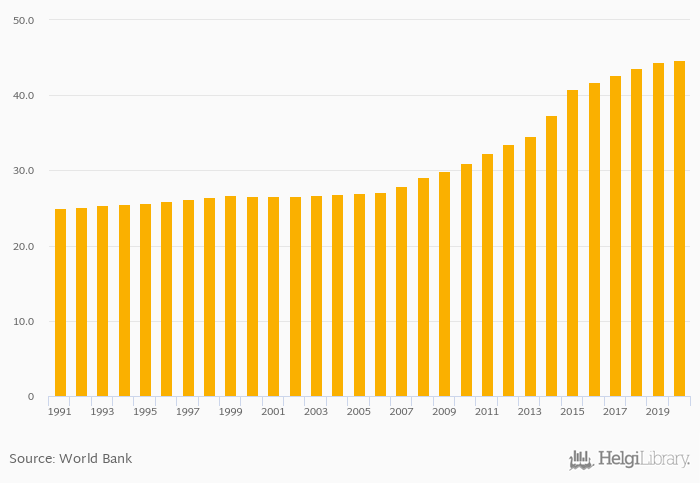
Employees In Services, Male (As % of Male Employment) rose 0.847% to 44.7% in Ghana in 2020, according to World Bank.
Historically, Employees In Services, Male (As % of Male Employment) in Ghana reached an all time high of 44.7% in 2020 and an all time low of 25.0% in 1991. When compared to Ghana's main peers, Employees In Services, Male (As % of Male Employment) in Benin amounted to 32.3%, 38.9% in Ivory Coast and 48.0% in Togo in 2020.
Ghana has been ranked 111th within the group of 173 countries we follow in terms of Employees In Services, Male (As % of Male Employment), 32 places above the position seen 10 years ago.
| Employees In Services, Male (As % of Male Employment) | Unit | 2000 | 2001 | 2002 | 2003 | 2004 | 2005 | 2006 | 2007 | 2008 | 2009 | 2010 | 2011 | 2012 | 2013 | 2014 | 2015 | 2016 | 2017 | 2018 | 2019 | 2020 |
| Benin | % | 30.9% | 31.2% | 31.5% | 32.0% | 32.5% | ||||||||||||||||
| Burkina Faso | % | 32.3% | 35.0% | 38.0% | 40.9% | 43.9% | ||||||||||||||||
| Ghana | % | 37.3% | 40.8% | 41.7% | 42.7% | 43.6% | ||||||||||||||||
| Guinea | % | 28.2% | 28.4% | 29.1% | 29.6% | 30.0% | ||||||||||||||||
| Ivory Coast | % | 38.9% | 38.5% | 38.0% | 37.7% | 38.3% | ||||||||||||||||
| Liberia | % | 39.3% | 39.6% | 39.5% | 40.0% | 40.5% | ||||||||||||||||
| Mali | % | 23.9% | 27.5% | 25.4% | 27.0% | 28.0% | ||||||||||||||||
| Niger | % | 19.5% | 19.7% | 19.8% | 20.0% | 20.2% | ||||||||||||||||
| Nigeria | % | 42.8% | 43.2% | 43.2% | 43.5% | 43.8% | ||||||||||||||||
| Togo | % | 45.5% | 44.0% | 42.3% | 40.3% | 40.8% |
 Helgi Library


