
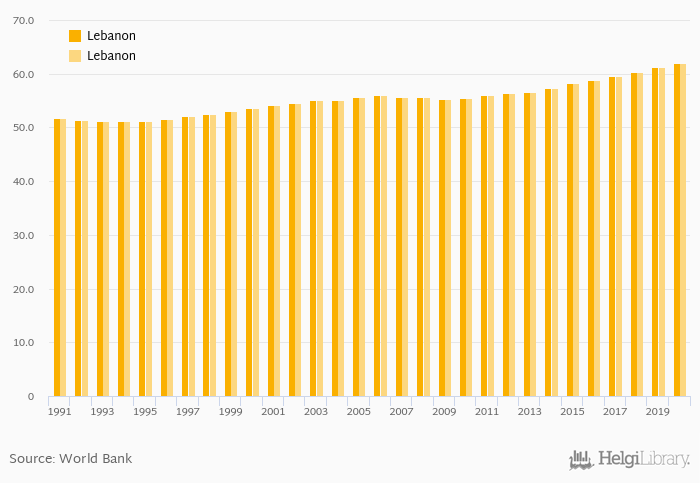
Employees In Services, Male (As % of Male Employment) rose 1.14% to 61.9% in Lebanon in 2020, according to World Bank.
Historically, Employees In Services, Male (As % of Male Employment) in Lebanon reached an all time high of 61.9% in 2020 and an all time low of 51.1% in 1993. When compared to Lebanon's main peers, Employees In Services, Male (As % of Male Employment) in Cyprus amounted to 72.3%, 73.6% in Israel, 69.9% in Jordan and 59.4% in Syria in 2020.
Lebanon has been ranked 38th within the group of 173 countries we follow in terms of Employees In Services, Male (As % of Male Employment), 14 places above the position seen 10 years ago.
| Employees In Services, Male (As % of Male Employment) | Unit | 2000 | 2001 | 2002 | 2003 | 2004 | 2005 | 2006 | 2007 | 2008 | 2009 | 2010 | 2011 | 2012 | 2013 | 2014 | 2015 | 2016 | 2017 | 2018 | 2019 | 2020 |
| Cyprus | % | 68.7% | 69.5% | 68.5% | 70.5% | 71.5% | ||||||||||||||||
| Egypt | % | 47.1% | 47.8% | 47.2% | 46.4% | 46.6% | ||||||||||||||||
| Greece | % | 65.8% | 66.8% | 66.9% | 67.0% | 66.9% | ||||||||||||||||
| Iraq | % | 54.3% | 55.4% | 55.0% | 56.3% | 57.2% | ||||||||||||||||
| Israel | % | 72.2% | 72.6% | 72.9% | 73.0% | 73.0% | ||||||||||||||||
| Jordan | % | 69.5% | 69.8% | 70.2% | 70.4% | 70.7% | ||||||||||||||||
| Lebanon | % | 57.3% | 58.2% | 58.8% | 59.5% | 60.3% | ||||||||||||||||
| Saudi Arabia | % | 67.8% | 67.0% | 66.1% | 67.6% | 69.0% | ||||||||||||||||
| Syria | % | 60.8% | 61.9% | 62.7% | 63.3% | 63.5% | ||||||||||||||||
| Turkey | % | 51.5% | 52.2% | 53.0% | 53.1% | 53.5% |
 Helgi Library


