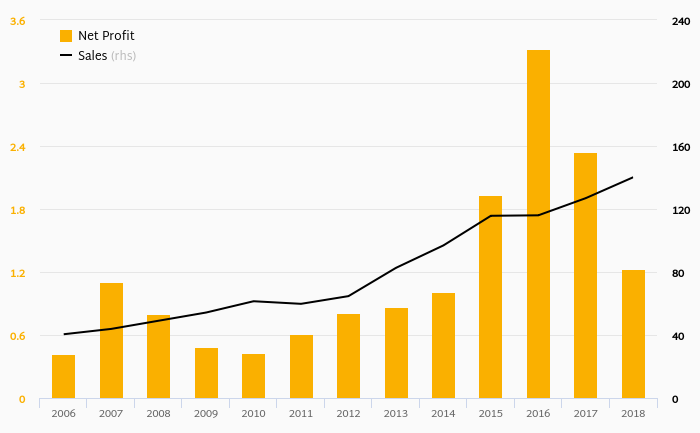
EuroVast made a net profit of EUR 1.23 mil in 2018, down 47.5% compared to the previous year. Historically, between 2006 and 2018, the company's net profit reached a high of EUR 3.33 mil in 2016 and a low of EUR 0.423 mil in 2006.
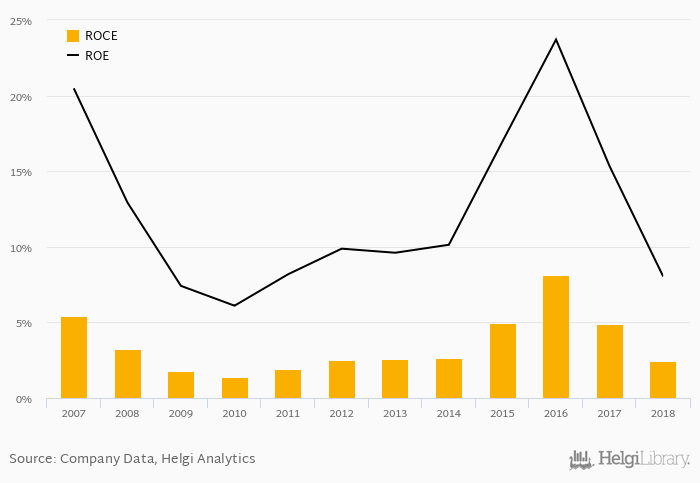
The result implies a return on equity of 8.04% and a return on invested capital of 2.43% in 2018. That is compared to an average of 14.8% and 4.63% over the last five years.
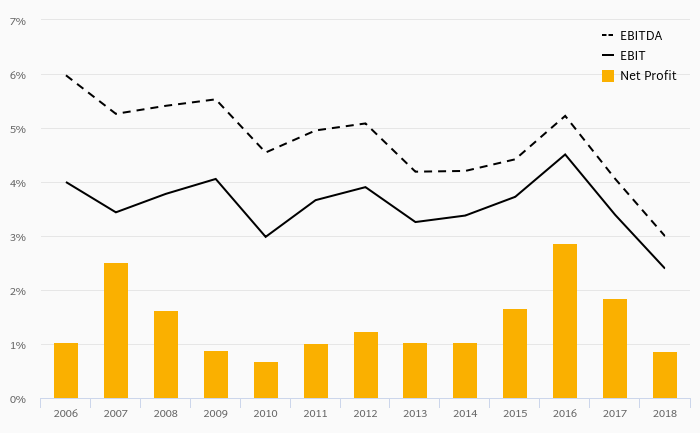
The company has been operating with average EBITDA margin of 4.18% in the last 5 years and an average net margin of 1.66%.
Since 2013, the firm's net profit increased by 42.2% or an average of 7.30% a year.
You can see all the company’s data at EuroVast profile, or you can download a report on the company in the report section.
ROCE | Unit | 1969 | 1970 | 1971 | 1972 | 1973 | 1974 | 1975 | 1976 | 1977 | 1978 | 1979 | 1980 | 1981 | 1982 | 1983 | 1984 | 1985 | 1986 | 1987 | 1988 | 1989 | 1990 | 1991 | 1992 | 1993 | 1994 | 1995 | 1996 | 1997 | 1998 | 1999 | 2000 | 2001 | 2002 | 2003 | 2004 | 2005 | 2006 | 2007 | 2008 | 2009 | 2010 | 2011 | 2012 | 2013 | 2014 | 2015 | 2016 | 2017 | 2018 |
Cartiera Giusta | % | ... | ... | ... | ... | ... | ... | ... | ... | ... | ... | ... | ... | ... | ... | ... | ... | ... | ... | ... | ... | ... | ... | ... | ... | ... | ... | ... | ... | ... | ... | ... | ... | ... | ... | ... | ... | ... | ... | ... | ... | ... | ... | -38.1% | -16.0% | 2.98% | -1.12% | 2.26% | |||
Cartiere Carrara | % | ... | ... | ... | ... | ... | ... | ... | ... | ... | ... | ... | ... | ... | ... | ... | ... | ... | ... | ... | ... | ... | ... | ... | ... | ... | ... | ... | ... | ... | ... | ... | ... | ... | ... | ... | ... | ... | ... | -0.283% | 0.166% | 0.062% | 0.260% | 5.02% | ... | ... | |||||
EuroVast | % | ... | ... | ... | ... | ... | ... | ... | ... | ... | ... | ... | ... | ... | ... | ... | ... | ... | ... | ... | ... | ... | ... | ... | ... | ... | ... | ... | ... | ... | ... | ... | ... | ... | ... | ... | ... | ... | ... | 2.52% | 2.55% | 2.68% | 4.96% | 8.14% | |||||||
AVERAGE | % | ... | ... | ... | ... | ... | ... | ... | ... | ... | ... | ... | ... | ... | ... | ... | ... | ... | ... | ... | ... | ... | ... | ... | ... | ... | ... | ... | ... | ... | ... | ... | ... | ... | ... | ... | ... | ... | ... | 3.64% | 6.52% | 7.79% | 3.02% | 56.5% | -12.0% | -4.42% | 1.91% | 1.37% | 5.14% | -0.069% | -4.24% |