
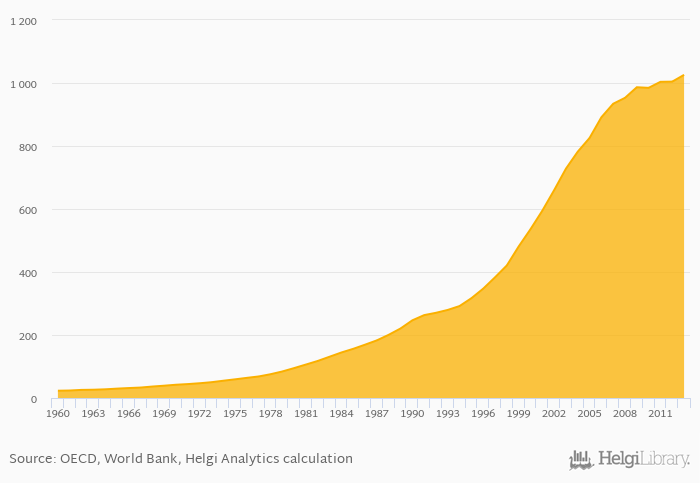
Expenditure on pharmaceuticals per capita rose 2.15% to USD 1,026 in the USA in 2013, according to OECD.
Historically, expenditure on pharmaceuticals per capita in the USA reached an all time high of USD 1,026 in 2013 and an all time low of USD 23.1 in 1960.
USA has been ranked 1st within the group of 35 countries we follow in terms of expenditure on pharmaceuticals per capita.
| Expenditure on Pharmaceuticals Per Capita (USD) | Unit | 1999 | 2000 | 2001 | 2002 | 2003 | 2004 | 2005 | 2006 | 2007 | 2008 | 2009 | 2010 | 2011 | 2012 | 2013 | 2014 | 2015 | 2016 | 2017 | 2018 | 2019 |
| Australia | USD | 490 | 432 | 399 | 464 | 458 | ... | |||||||||||||||
| Belize | USD | ... | ... | ... | ... | ... | ... | ... | ... | ... | ... | ... | ... | ... | ... | ... | ... | ... | ... | ... | ... | ... |
| Canada | USD | ... | ... | ... | ... | ... | ... | ... | ... | ... | ... | ... | ... | ... | 681 | 650 | 599 | 580 | 635 | |||
| China | USD | ... | ... | ... | ... | ... | ... | ... | ... | ... | ... | ... | ... | ... | ... | ... | ... | ... | ... | ... | ... | ... |
| Guatemala | USD | ... | ... | ... | ... | ... | ... | ... | ... | ... | ... | ... | ... | ... | ... | ... | ... | ... | ... | ... | ... | ... |
| Honduras | USD | ... | ... | ... | ... | ... | ... | ... | ... | ... | ... | ... | ... | ... | ... | ... | ... | ... | ... | ... | ... | ... |
| India | USD | ... | ... | ... | ... | ... | ... | ... | ... | ... | ... | ... | ... | ... | ... | ... | ... | ... | ... | ... | ... | ... |
| Japan | USD | 557 | 464 | 446 | 445 | 469 | ... | |||||||||||||||
| Mexico | USD | 58.5 | 51.6 | 46.8 | 41.4 | 39.3 | ... | ... | ||||||||||||||
| Russia | USD | ... | ... | ... | ... | ... | ... | ... | ... | ... | ... | ... | ... | ... | ... | ... | ... | ... | ... | ... | ... | ... |
| South Korea | USD | 420 | 450 | 441 | 432 | 478 | ... | |||||||||||||||
| USA | USD | 1,026 | ... | ... | ... | ... | ... | ... | ||||||||||||||
| United Kingdom | USD | 363 | 407 | 424 | 392 | 394 | ... |
 Helgi Library


