
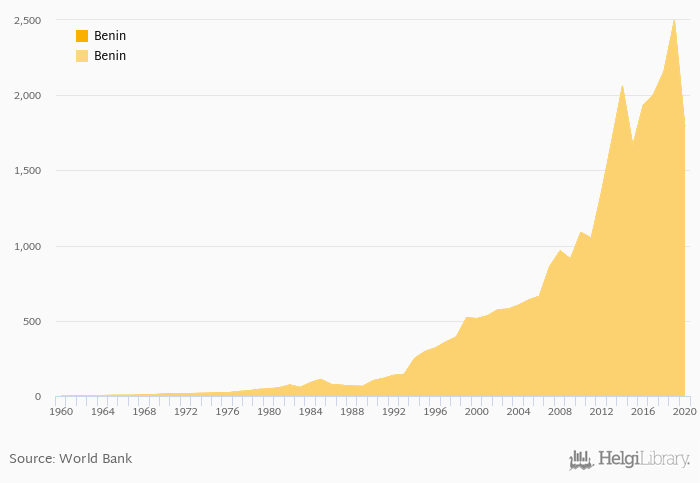
Exports of goods and services fell 28.3% to XOF 1,790 bil in Benin in 2020, according to the National Statistical Office.
Historically, exports of goods and services in Benin reached an all time high of XOF 2,499 bil in 2019 and an all time low of XOF 2.04 bil in 1962.
Benin has been ranked 52nd within the group of 161 countries we follow in terms of exports of goods and services, 1 place below the position seen 10 years ago.
| Exports of Goods and Services (Local Currency) | Unit | 2001 | 2002 | 2003 | 2004 | 2005 | 2006 | 2007 | 2008 | 2009 | 2010 | 2011 | 2012 | 2013 | 2014 | 2015 | 2016 | 2017 | 2018 | 2019 | 2020 | 2021 |
| Algeria | DZD bil | 3,873 | 3,656 | 4,272 | 5,274 | 4,657 | ||||||||||||||||
| Benin | XOF bil | 1,664 | 1,934 | 2,006 | 2,161 | 2,499 | ||||||||||||||||
| Burkina Faso | XOF bil | 1,826 | 1,971 | 2,167 | 2,478 | 2,618 | ... | ... | ||||||||||||||
| Cameroon | XAF bil | 3,997 | 3,797 | 3,847 | 4,160 | 4,614 | ||||||||||||||||
| Chad | XAF bil | 1,942 | 1,573 | 1,967 | 2,259 | 2,436 | ||||||||||||||||
| Ghana | GHS bil | 62.1 | 68.5 | 89.0 | 103 | 134 | ||||||||||||||||
| Ivory Coast | XOF bil | 7,410 | 6,991 | 7,465 | 7,295 | 8,155 | ||||||||||||||||
| Libya | LYD bil | 15.0 | 10.1 | 25.5 | 41.5 | 41.5 | ... | |||||||||||||||
| Mali | XOF bil | 1,863 | 1,949 | 1,982 | 2,325 | 2,603 | ||||||||||||||||
| Niger | XOF bil | 817 | 751 | 863 | 842 | 864 | ||||||||||||||||
| Nigeria | NGN bil | 10,152 | 9,456 | 15,134 | 20,004 | 20,711 | ||||||||||||||||
| Togo | XOF bil | 886 | 962 | 938 | 946 | 976 |
 Helgi Library


