
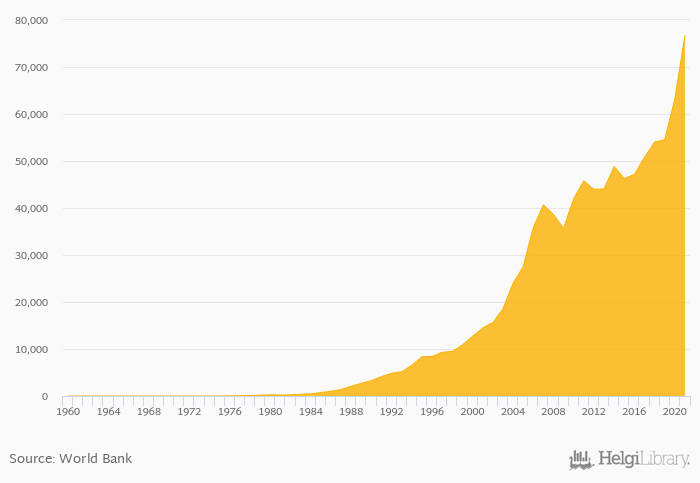
Exports of goods and services rose 21.5% to CLP 76,740 bil in Chile in 2021, according to the National Statistical Office.
Historically, exports of goods and services in Chile reached an all time high of CLP 76,740 bil in 2021 and an all time low of CLP < 0.001 bil in 1961. When compared to Chile's main peers, exports of goods and services in Argentina amounted to ARS 8,347 bil, BOB 77.7 bil in Bolivia, PYG 96,266 bil in Paraguay and USD 813 bil in Uruguay in 2021.
Chile has been ranked 11th within the group of 152 countries we follow in terms of exports of goods and services, 2 places below the position seen 10 years ago.
| Exports of Goods and Services (Local Currency) | Unit | 2001 | 2002 | 2003 | 2004 | 2005 | 2006 | 2007 | 2008 | 2009 | 2010 | 2011 | 2012 | 2013 | 2014 | 2015 | 2016 | 2017 | 2018 | 2019 | 2020 | 2021 |
| Argentina | ARS bil | 637 | 1,031 | 1,207 | 2,129 | 3,864 | ||||||||||||||||
| Bolivia | BOB bil | 70.4 | 57.4 | 64.5 | 72.3 | 70.6 | ||||||||||||||||
| Brazil | BRL bil | 773 | 782 | 824 | 1,025 | 1,044 | ||||||||||||||||
| Chile | CLP bil | 46,304 | 47,124 | 50,802 | 54,044 | 54,504 | ||||||||||||||||
| Paraguay | PYG bil | 65,526 | 76,058 | 84,232 | 85,187 | 85,637 | ||||||||||||||||
| Peru | PEN bil | 129 | 146 | 170 | 184 | 183 | ||||||||||||||||
| Uruguay | USD bil | 327 | 465 | 482 | 523 | 599 |
 Helgi Library


