
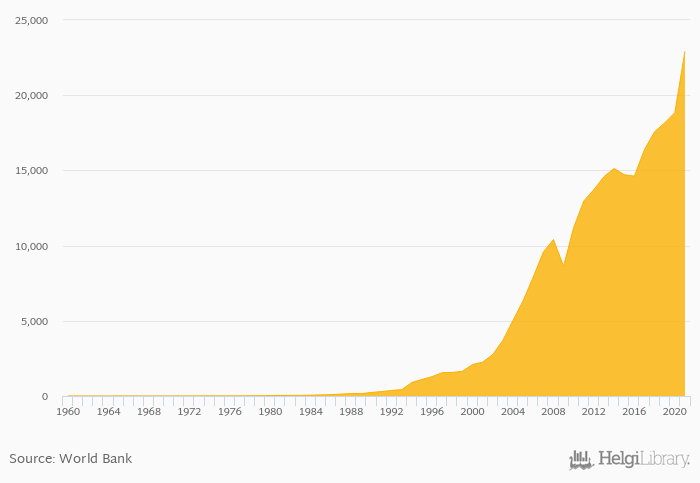
Exports of goods and services rose 21.6% to CNY 22,917 bil in China in 2021, according to the National Statistical Office.
Historically, exports of goods and services in China reached an all time high of CNY 22,917 bil in 2021 and an all time low of CNY 4.71 bil in 1962. When compared to China's main peers, exports of goods and services in India amounted to INR 50,639 bil, JPY 99,930 bil in Japan, RUB 40,426 bil in Russia and UYU 2,540 bil in USA in 2021.
China has been ranked 23rd within the group of 152 countries we follow in terms of exports of goods and services, 3 places below the position seen 10 years ago.
| Exports of Goods and Services (Local Currency) | Unit | 2001 | 2002 | 2003 | 2004 | 2005 | 2006 | 2007 | 2008 | 2009 | 2010 | 2011 | 2012 | 2013 | 2014 | 2015 | 2016 | 2017 | 2018 | 2019 | 2020 | 2021 |
| Bangladesh | BDT bil | 2,628 | 2,890 | 2,980 | 3,345 | 3,865 | ||||||||||||||||
| Canada | CAD bil | 634 | 638 | 673 | 722 | 738 | ||||||||||||||||
| China | CNY bil | 14,710 | 14,618 | 16,385 | 17,569 | 18,162 | ||||||||||||||||
| Germany | EUR bil | 1,420 | 1,444 | 1,541 | 1,592 | 1,621 | ||||||||||||||||
| India | INR bil | 27,286 | 29,488 | 32,115 | 37,663 | 37,522 | ||||||||||||||||
| Japan | JPY bil | 93,815 | 87,414 | 97,294 | 101,947 | 97,431 | ||||||||||||||||
| Mexico | MXN bil | 6,412 | 7,456 | 8,259 | 9,235 | 9,490 | ||||||||||||||||
| Pakistan | PKR bil | 2,910 | 2,859 | 2,923 | 3,363 | 4,113 | ||||||||||||||||
| Russia | RUB bil | 23,849 | 22,136 | 23,963 | 31,982 | 31,165 | ||||||||||||||||
| South Korea | KRW bil | 712,776 | 698,621 | 751,429 | 791,799 | 755,863 | ||||||||||||||||
| Sri Lanka | SKR bil | 2,301 | 2,540 | 2,910 | 3,292 | 3,472 | ||||||||||||||||
| USA | UYU bil | 2,269 | 2,232 | 2,388 | 2,538 | 2,538 |
 Helgi Library


