
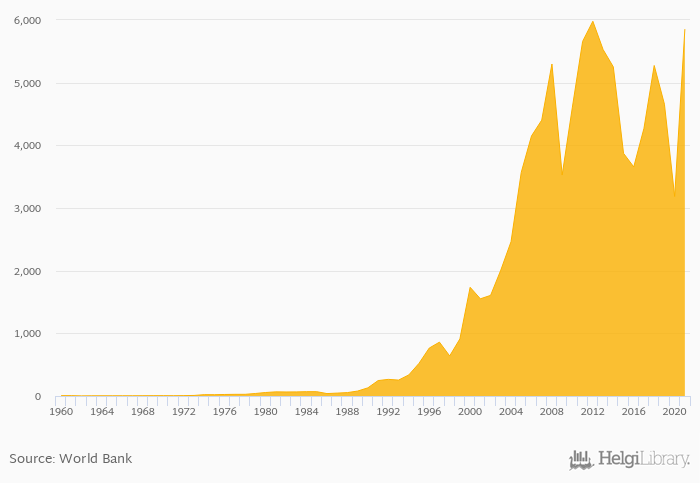
Exports of goods and services rose 83.9% to DZD 5,854 bil in Algeria in 2021, according to the National Statistical Office.
Historically, exports of goods and services in Algeria reached an all time high of DZD 5,980 bil in 2012 and an all time low of DZD 1.96 bil in 1962.
Algeria has been ranked 35th within the group of 152 countries we follow in terms of exports of goods and services, 5 places below the position seen 10 years ago.
| Exports of Goods and Services (Local Currency) | Unit | 2001 | 2002 | 2003 | 2004 | 2005 | 2006 | 2007 | 2008 | 2009 | 2010 | 2011 | 2012 | 2013 | 2014 | 2015 | 2016 | 2017 | 2018 | 2019 | 2020 | 2021 |
| Algeria | DZD bil | 3,873 | 3,656 | 4,272 | 5,274 | 4,657 | ||||||||||||||||
| Chad | XAF bil | 1,942 | 1,573 | 1,967 | 2,259 | 2,436 | ||||||||||||||||
| Egypt | EGP bil | 322 | 280 | 549 | 839 | 931 | ||||||||||||||||
| France | EUR bil | 673 | 676 | 711 | 749 | 770 | ||||||||||||||||
| Italy | EUR bil | 492 | 497 | 534 | 555 | 568 | ||||||||||||||||
| Libya | LYD bil | 15.0 | 10.1 | 25.5 | 41.5 | 41.5 | ... | |||||||||||||||
| Malta | EUR bil | 15.5 | 16.6 | 18.5 | 18.8 | 20.5 | ||||||||||||||||
| Mauritania | MRO bil | 60.5 | 76.5 | 84.0 | 97.6 | 123 | ||||||||||||||||
| Morocco | MAD bil | 323 | 336 | 375 | 404 | 423 | ||||||||||||||||
| Portugal | EUR bil | 73.0 | 75.0 | 83.7 | 89.1 | 93.3 | ||||||||||||||||
| Spain | EUR bil | 362 | 377 | 408 | 423 | 435 | ||||||||||||||||
| Tunisia | THD bil | 34.5 | 36.5 | 42.6 | 51.4 | 56.5 |
 Helgi Library


