
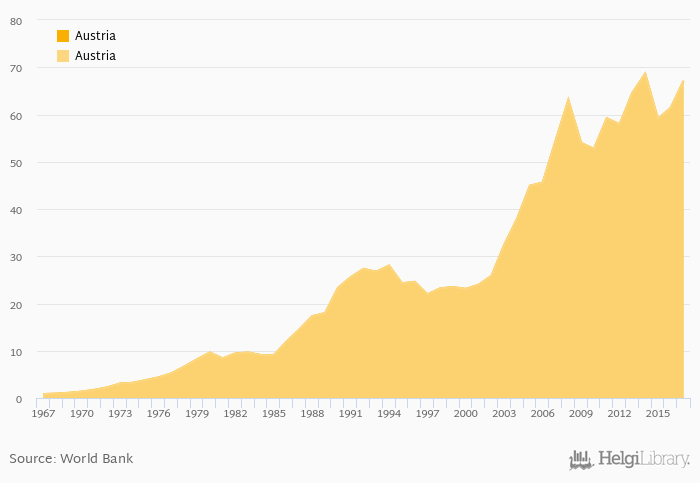
Exports of services as a part of balance of payment rose 8.67% to USD 66.8 bil in Austria in 2017, according to the National Statistical Office.
Historically, exports of services as a part of balance of payment in Austria reached an all time high of USD 68.6 bil in 2014 and an all time low of USD 0.834 bil in 1967. When compared to Austria's main peers, exports of services as a part of balance of payment in Germany amounted to USD 309 bil, USD 26.9 bil in Hungary, USD 112 bil in Italy and USD 122 bil in Switzerland in 2017.
Austria has been ranked 22nd within the group of 154 countries we follow in terms of exports of services as a part of balance of payment, 2 places below the position seen 10 years ago.
| Exports of Services (BoP, USD) | Unit | 2001 | 2002 | 2003 | 2004 | 2005 | 2006 | 2007 | 2008 | 2009 | 2010 | 2011 | 2012 | 2013 | 2014 | 2015 | 2016 | 2017 | 2018 | 2019 | 2020 | 2021 |
| Austria | USD bil | 59.1 | 61.4 | 67.1 | 75.9 | 76.7 | ||||||||||||||||
| Belgium | USD bil | ... | 109 | 109 | 118 | 124 | 124 | |||||||||||||||
| Czechia | USD bil | 23.3 | 24.4 | 27.4 | 30.6 | 30.4 | ||||||||||||||||
| France | USD bil | 256 | 259 | 275 | 302 | 296 | ||||||||||||||||
| Germany | USD bil | 281 | 293 | 322 | 357 | 356 | ||||||||||||||||
| Hungary | USD bil | 22.5 | 24.2 | 27.0 | 30.0 | 30.1 | ||||||||||||||||
| Italy | USD bil | 98.3 | 101 | 113 | 123 | 122 | ||||||||||||||||
| Poland | USD bil | 44.1 | 48.7 | 57.9 | 68.1 | 70.2 | ||||||||||||||||
| Slovakia | USD bil | 8.12 | 9.24 | 10.6 | 12.1 | 12.3 | ||||||||||||||||
| Slovenia | USD bil | 6.60 | 7.21 | 8.39 | 9.57 | 9.69 | ||||||||||||||||
| Switzerland | USD bil | 125 | 127 | 129 | 139 | 136 |
 Helgi Library


