Follow us for the latest automotive news.
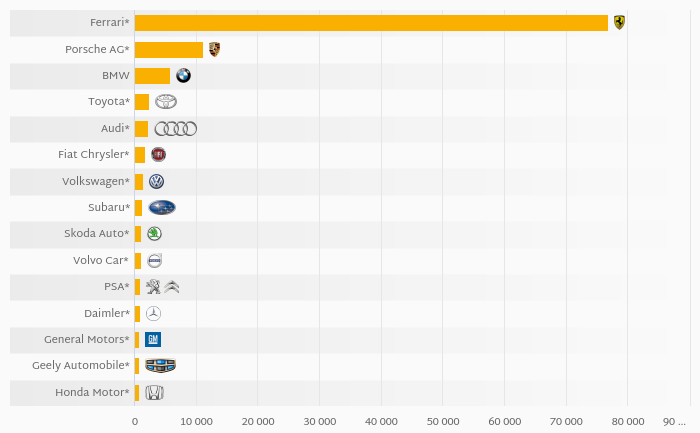
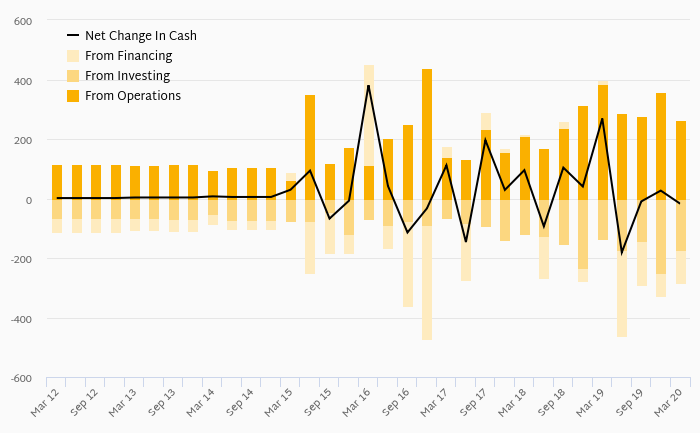
Ferrari's operating cash flow stood at EUR 1,306 mil in 2019, up 39.8% when compared to the previous year. Historically, between 2012 - 2019, the firm’s operating cash flow reached a high of EUR 1,306 mil in 2019 and a low of EUR 426 mil in 2014.
Ferrari's total investments stood at EUR -701 mil and accounted for 18.6% of sales in 2019. This is compared to an average of 14.1% as seen over the last five years.
Cash from financing amounted to EUR -502 mil, so the company generated EUR 104 mil net cash in 2019.
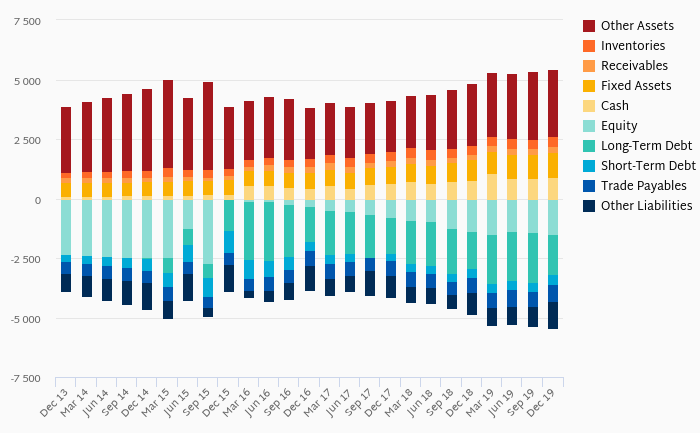
At the end of 2019, the company had a net debt of EUR 1,192 mil, or 1.07x of EBITDA and 80.1% of equity. Net working capital amounted to EUR -60.0 mil, or -1.59% of sales. The cash conversion cycle stood at -36.5 days in 2019. This is an improvement compared to the previous year (-36.5 days), so Ferrari’s working capital was tied up for 0.014 fewer days.
You can see all the company’s data at Ferrari profile, or you can download a report on the company in the report section.
 Helgi Library