
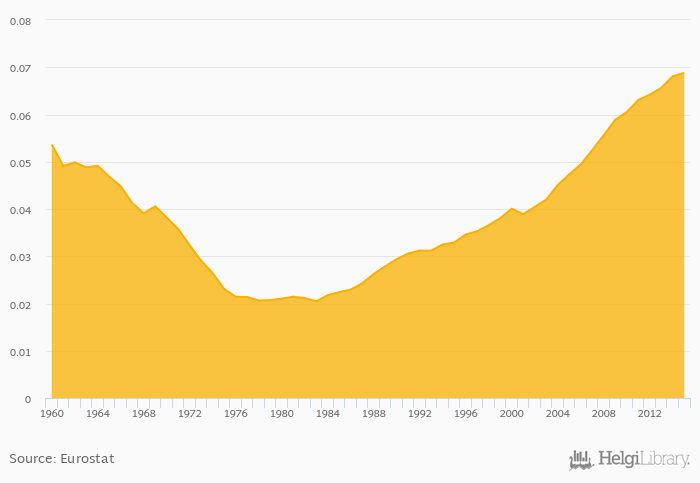
Fertility Rate by Age (From 35 to 39 years) rose 1.06% to 0.069 in Switzerland in 2015, according to Eurostat.
Historically, Fertility Rate by Age (From 35 to 39 years) in Switzerland reached an all time high of 0.069 in 2015 and an all time low of 0.020 in 1983. When compared to Switzerland's main peers, Fertility Rate by Age (From 35 to 39 years) in Austria amounted to 0.052, 0.064 in France, 0.059 in Germany and 0.059 in Italy in 2015.
Switzerland has been ranked 2nd within the group of 39 countries we follow in terms of Fertility Rate by Age (From 35 to 39 years), 11 places above the position seen 10 years ago.
| Fertility Rate by Age (From 35 to 39 years) | Unit | 1995 | 1996 | 1997 | 1998 | 1999 | 2000 | 2001 | 2002 | 2003 | 2004 | 2005 | 2006 | 2007 | 2008 | 2009 | 2010 | 2011 | 2012 | 2013 | 2014 | 2015 |
| Austria | 0.040 | 0.043 | 0.044 | 0.046 | 0.047 | |||||||||||||||||
| Belgium | 0.045 | 0.048 | 0.048 | 0.049 | 0.050 | |||||||||||||||||
| France | ... | ... | ... | 0.057 | 0.058 | 0.058 | 0.059 | 0.061 | ||||||||||||||
| Germany | ... | ... | ... | ... | ... | 0.043 | 0.047 | 0.049 | 0.051 | 0.054 | ||||||||||||
| Hungary | 0.034 | 0.035 | 0.037 | 0.039 | 0.041 | |||||||||||||||||
| Italy | 0.060 | 0.062 | 0.062 | 0.061 | 0.060 | |||||||||||||||||
| Poland | 0.030 | 0.032 | 0.031 | 0.031 | 0.030 | |||||||||||||||||
| Slovenia | 0.039 | 0.042 | 0.044 | 0.044 | 0.042 | |||||||||||||||||
| Spain | 0.060 | 0.062 | 0.063 | 0.063 | 0.061 | |||||||||||||||||
| Switzerland | 0.059 | 0.061 | 0.063 | 0.064 | 0.066 |
 Helgi Library


