
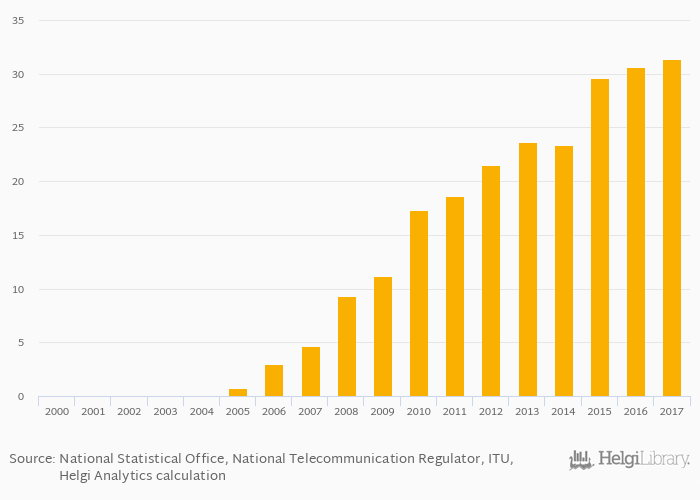
Fixed broadband internet lines per household rose 2.57% to 31.4% in Ukraine in 2017, according to World Bank.
Historically, fixed broadband internet lines per household in Ukraine reached an all time high of 31.4% in 2017 and an all time low of 0% in 2000. When compared to Ukraine's main peers, fixed broadband internet lines per household in Poland amounted to 51.4%, 67.0% in Romania and 58.8% in Russia in 2017.
Ukraine has been ranked 78th within the group of 104 countries we follow in terms of fixed broadband internet lines per household, 1 place below the position seen 10 years ago.
| Fixed Broadband Internet Lines Per Household | Unit | 1997 | 1998 | 1999 | 2000 | 2001 | 2002 | 2003 | 2004 | 2005 | 2006 | 2007 | 2008 | 2009 | 2010 | 2011 | 2012 | 2013 | 2014 | 2015 | 2016 | 2017 |
| Bulgaria | % | ... | ... | ... | 41.8% | 44.5% | 47.6% | 49.8% | 54.5% | |||||||||||||
| China | % | ... | ... | ... | 35.2% | 38.9% | 41.3% | 43.3% | 59.1% | |||||||||||||
| Czechia | % | ... | ... | ... | 56.2% | 58.9% | 62.7% | 65.1% | 63.5% | |||||||||||||
| Germany | % | ... | ... | ... | 67.4% | 69.0% | 70.6% | 72.8% | 75.4% | |||||||||||||
| Hungary | % | ... | ... | ... | 56.8% | 58.6% | 63.1% | 62.4% | 65.4% | |||||||||||||
| Japan | % | ... | ... | ... | 68.1% | 68.3% | 69.1% | 70.0% | 71.3% | |||||||||||||
| Moldova | % | ... | ... | ... | 32.1% | 37.9% | 42.6% | 46.4% | 48.8% | |||||||||||||
| Poland | % | ... | ... | ... | 51.5% | 50.7% | 51.7% | 53.1% | 53.2% | |||||||||||||
| Romania | % | ... | ... | ... | 46.3% | 49.9% | 53.4% | 56.5% | 59.9% | |||||||||||||
| Russia | % | ... | ... | ... | 33.6% | 39.8% | 45.2% | 47.5% | 51.2% | |||||||||||||
| USA | % | ... | ... | ... | 74.4% | 76.4% | 78.4% | 79.4% | 82.2% | |||||||||||||
| Ukraine | % | ... | ... | ... | 18.6% | 21.5% | 23.6% | 23.4% | 29.6% |
 Helgi Library


