
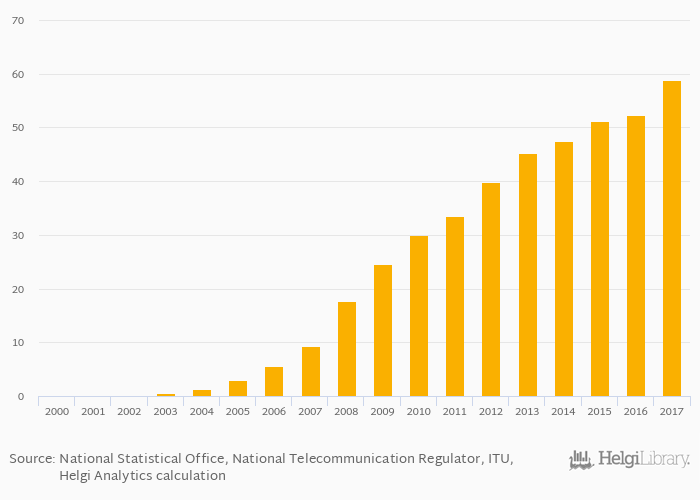
Fixed broadband internet lines per household rose 12.2% to 58.8% in Russia in 2017, according to World Bank.
Historically, fixed broadband internet lines per household in Russia reached an all time high of 58.8% in 2017 and an all time low of 0% in 2000. When compared to Russia's main peers, fixed broadband internet lines per household in China amounted to 78.6%, 81.3% in Germany, 72.6% in Japan and 86.8% in USA in 2017.
Russia has been ranked 52nd within the group of 104 countries we follow in terms of fixed broadband internet lines per household, 11 places above the position seen 10 years ago.
| Fixed Broadband Internet Lines Per Household | Unit | 1997 | 1998 | 1999 | 2000 | 2001 | 2002 | 2003 | 2004 | 2005 | 2006 | 2007 | 2008 | 2009 | 2010 | 2011 | 2012 | 2013 | 2014 | 2015 | 2016 | 2017 |
| Austria | % | ... | ... | ... | 57.5% | 58.0% | 60.4% | 63.4% | 65.6% | |||||||||||||
| Belgium | % | ... | ... | ... | 76.3% | 79.1% | 81.7% | 85.2% | 87.1% | |||||||||||||
| Canada | % | ... | ... | ... | 84.7% | 85.9% | 88.0% | 90.5% | 92.9% | |||||||||||||
| China | % | ... | ... | ... | 35.2% | 38.9% | 41.3% | 43.3% | 59.1% | |||||||||||||
| France | % | ... | ... | ... | 79.6% | 83.6% | 86.5% | 89.7% | 92.5% | |||||||||||||
| Germany | % | ... | ... | ... | 67.4% | 69.0% | 70.6% | 72.8% | 75.4% | |||||||||||||
| India | % | ... | ... | ... | 5.41% | 5.98% | 5.87% | 6.10% | 6.47% | |||||||||||||
| Japan | % | ... | ... | ... | 68.1% | 68.3% | 69.1% | 70.0% | 71.3% | |||||||||||||
| Mexico | % | ... | ... | ... | 40.1% | 44.4% | 42.3% | 42.3% | 46.9% | |||||||||||||
| Poland | % | ... | ... | ... | 51.5% | 50.7% | 51.7% | 53.1% | 53.2% | |||||||||||||
| Russia | % | ... | ... | ... | 33.6% | 39.8% | 45.2% | 47.5% | 51.2% | |||||||||||||
| South Korea | % | ... | ... | ... | 102% | 102% | 104% | 105% | 108% | |||||||||||||
| USA | % | ... | ... | ... | 74.4% | 76.4% | 78.4% | 79.4% | 82.2% |
 Helgi Library


