
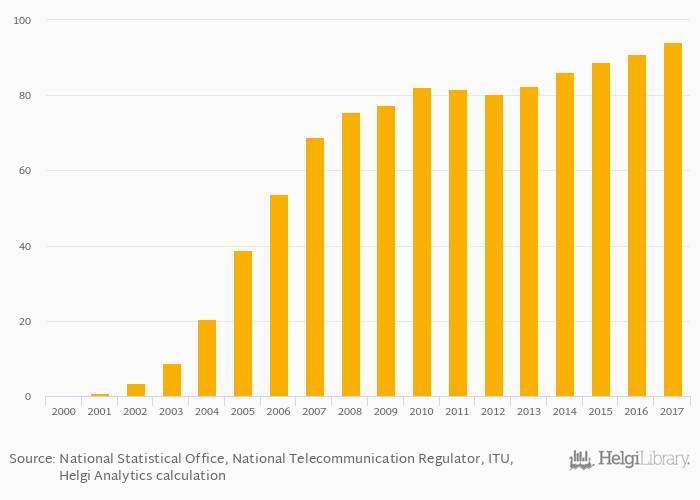
Fixed broadband internet lines per household rose 3.42% to 94.2% in Luxembourg in 2017, according to World Bank.
Historically, fixed broadband internet lines per household in Luxembourg reached an all time high of 94.2% in 2017 and an all time low of 0% in 2000. When compared to Luxembourg's main peers, fixed broadband internet lines per household in Belgium amounted to 91.7%, 97.0% in France, 81.3% in Germany and 94.4% in Netherlands in 2017.
Luxembourg has been ranked 12th within the group of 104 countries we follow in terms of fixed broadband internet lines per household, 1 place below the position seen 10 years ago.
| Fixed Broadband Internet Lines Per Household | Unit | 1997 | 1998 | 1999 | 2000 | 2001 | 2002 | 2003 | 2004 | 2005 | 2006 | 2007 | 2008 | 2009 | 2010 | 2011 | 2012 | 2013 | 2014 | 2015 | 2016 | 2017 |
| Austria | % | ... | ... | ... | 57.5% | 58.0% | 60.4% | 63.4% | 65.6% | |||||||||||||
| Belgium | % | ... | ... | ... | 76.3% | 79.1% | 81.7% | 85.2% | 87.1% | |||||||||||||
| Denmark | % | ... | ... | ... | 82.6% | 83.6% | 86.8% | 89.0% | 91.1% | |||||||||||||
| France | % | ... | ... | ... | 79.6% | 83.6% | 86.5% | 89.7% | 92.5% | |||||||||||||
| Germany | % | ... | ... | ... | 67.4% | 69.0% | 70.6% | 72.8% | 75.4% | |||||||||||||
| Italy | % | ... | ... | ... | 55.2% | 55.7% | 56.3% | 57.4% | 59.0% | |||||||||||||
| Luxembourg | % | ... | ... | ... | 81.6% | 80.4% | 82.5% | 86.1% | 88.8% | |||||||||||||
| Netherlands | % | ... | ... | ... | 88.1% | 89.6% | 91.0% | 91.2% | 93.1% | |||||||||||||
| Poland | % | ... | ... | ... | 51.5% | 50.7% | 51.7% | 53.1% | 53.2% | |||||||||||||
| Spain | % | ... | ... | ... | 64.5% | 65.9% | 69.5% | 73.1% | 75.5% | |||||||||||||
| United Kingdom | % | ... | ... | ... | 77.6% | 80.9% | 85.1% | 86.8% | 89.4% |
 Helgi Library


