
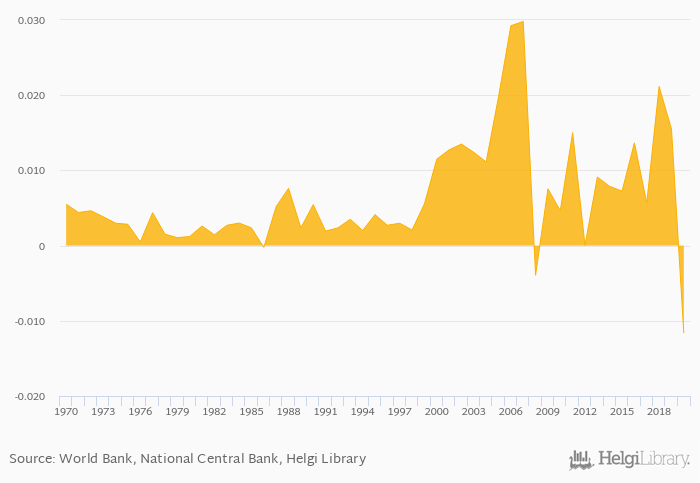
Foreign direct investments as a share of GDP fell 175% to -0.012% in Italy in 2020, according to the National Statistical Office.
Historically, foreign direct investments as a share of GDP in Italy reached an all time high of 0.030% in 2007 and an all time low of -0.012% in 2020. When compared to Italy's main peers, foreign direct investments as a share of GDP in Austria amounted to -0.042%, 0.006% in France, 0.009% in Slovenia and -0.348% in Switzerland in 2020.
Italy has been ranked 151st within the group of 166 countries we follow in terms of foreign direct investments as a share of GDP, 4 places above the position seen 10 years ago.
| Foreign Direct Investments (As % of GDP) | Unit | 2001 | 2002 | 2003 | 2004 | 2005 | 2006 | 2007 | 2008 | 2009 | 2010 | 2011 | 2012 | 2013 | 2014 | 2015 | 2016 | 2017 | 2018 | 2019 | 2020 | 2021 |
| Austria | % | -0.021% | -0.073% | 0.032% | -0.063% | -0.030% | ||||||||||||||||
| Belgium | % | -0.042% | 0.121% | -0.074% | -0.077% | -0.056% | ||||||||||||||||
| Croatia | % | < 0.001% | 0.008% | 0.008% | 0.021% | 0.063% | ||||||||||||||||
| France | % | 0.018% | 0.013% | 0.014% | 0.028% | 0.020% | ||||||||||||||||
| Germany | % | 0.019% | 0.019% | 0.030% | 0.042% | 0.018% | ||||||||||||||||
| Hungary | % | -0.042% | 0.542% | -0.085% | -0.401% | 0.601% | ||||||||||||||||
| Italy | % | 0.007% | 0.014% | 0.006% | 0.021% | 0.016% | ||||||||||||||||
| Slovenia | % | 0.040% | 0.032% | 0.025% | 0.028% | 0.040% | ||||||||||||||||
| Spain | % | 0.019% | 0.036% | 0.024% | 0.041% | 0.018% | ||||||||||||||||
| Switzerland | % | 0.171% | 0.242% | 0.206% | -0.221% | 0.012% |
 Helgi Library


