
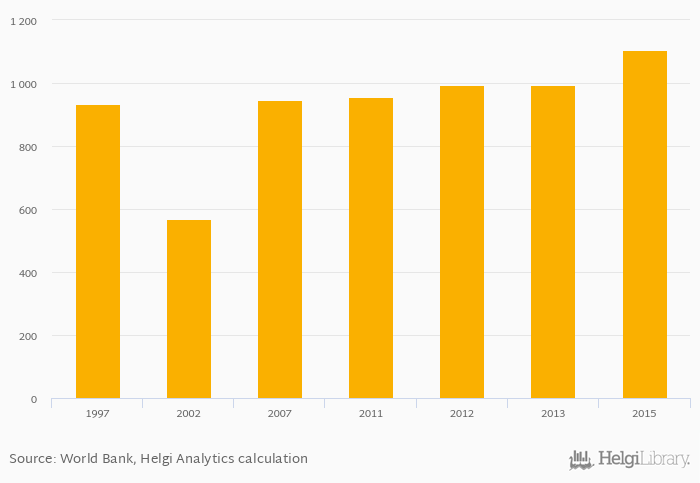
Freshwater withdrawals per capita rose 0% to 1,105 cbm in Armenia in 2015, according to World Bank / EIA.
Historically, freshwater withdrawals per capita in Armenia reached an all time high of 1,105 cbm in 2015 and an all time low of 569 cbm in 2002.
Armenia has been ranked 1st within the group of 8 countries we follow in terms of freshwater withdrawals per capita.
| Freshwater Withdrawals Per Capita | Unit | 1995 | 1996 | 1997 | 1998 | 1999 | 2000 | 2001 | 2002 | 2003 | 2004 | 2005 | 2006 | 2007 | 2008 | 2009 | 2010 | 2011 | 2012 | 2013 | 2014 | 2015 |
| Armenia | cbm | ... | ... | ... | ... | ... | ... | ... | ... | ... | ... | ... | ... | ... | 955 | 993 | 993 | ... | ||||
| Azerbaijan | cbm | ... | ... | ... | ... | ... | ... | ... | ... | ... | ... | ... | ... | ... | 1,329 | 1,290 | 1,279 | ... | ... | |||
| Bulgaria | cbm | ... | ... | ... | ... | ... | ... | ... | ... | ... | ... | ... | ... | ... | 835 | 843 | 851 | ... | ||||
| Georgia | cbm | ... | ... | ... | ... | ... | ... | ... | ... | ... | ... | ... | ... | ... | ... | ... | 415 | 419 | 422 | ... | ... | |
| Greece | cbm | ... | ... | ... | ... | ... | ... | ... | ... | ... | ... | ... | ... | ... | 853 | ... | 855 | ... | ... | |||
| Iran | cbm | ... | ... | ... | ... | ... | ... | ... | ... | ... | ... | ... | ... | ... | 1,239 | ... | 1,212 | ... | ... | |||
| Iraq | cbm | ... | ... | ... | ... | ... | ... | ... | ... | ... | ... | ... | ... | ... | ... | ... | ... | 1,963 | ... | ... | ||
| Pakistan | cbm | ... | ... | ... | ... | ... | ... | ... | ... | ... | ... | ... | ... | ... | 1,043 | 1,027 | 1,012 | ... | ... | |||
| Russia | cbm | ... | ... | ... | ... | ... | ... | ... | ... | ... | ... | ... | ... | ... | 462 | ... | 466 | ... | ... | |||
| Turkey | cbm | ... | ... | ... | ... | ... | ... | ... | ... | ... | ... | ... | ... | ... | 550 | ... | 538 | ... | ... | |||
| Turkmenistan | cbm | ... | ... | ... | ... | ... | ... | ... | ... | ... | ... | ... | ... | ... | 5,480 | ... | 5,362 | ... | ... |
 Helgi Library


