
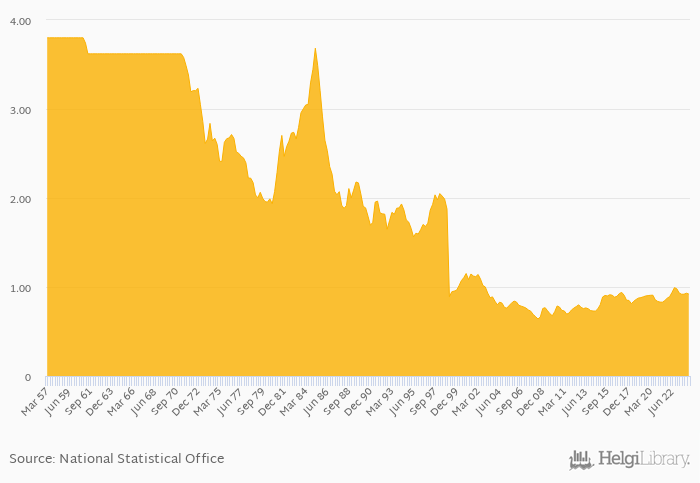
Average FX rate to USD fell 1.18% yoy to 0.921 per USD in Netherlands in 1Q2024, according to the National Statistical Office. This is 0.984% less than in the previous quarter.
Historically, Average FX rate to USD in Netherlands reached an all time high of 3.80 per USD in 1Q1957 and an all time low of 0.640 per USD in 2Q2008. When compared to Netherlands's main peers, Average FX rate to USD in Belgium amounted to 0.921 per USD, 6.87 per USD in Denmark, 0.921 per USD in Germany and 0.789 per USD in United Kingdom in 1Q2024.
Netherlands has been ranked 101st within the group of 121 countries we follow in terms of Average FX rate to USD, 45 places above the position seen 10 years ago.
| FX Rate to USD (Average) | Unit | Mar 2019 | Jun 2019 | Sep 2019 | Dec 2019 | Mar 2020 | Jun 2020 | Sep 2020 | Dec 2020 | Mar 2021 | Jun 2021 | Sep 2021 | Dec 2021 | Mar 2022 | Jun 2022 | Sep 2022 | Dec 2022 | Mar 2023 | Jun 2023 | Sep 2023 | Dec 2023 | Mar 2024 |
| Austria | per USD | 0.993 | 0.980 | 0.932 | 0.919 | 0.919 | ||||||||||||||||
| Belgium | per USD | 0.993 | 0.980 | 0.932 | 0.919 | 0.919 | ||||||||||||||||
| Denmark | per USD | 7.39 | 7.30 | 6.94 | 6.84 | 6.85 | ||||||||||||||||
| France | per USD | 0.993 | 0.980 | 0.932 | 0.919 | 0.919 | ||||||||||||||||
| Germany | per USD | 0.993 | 0.980 | 0.932 | 0.919 | 0.919 | ||||||||||||||||
| Ireland | per USD | 0.993 | 0.980 | 0.932 | 0.919 | 0.919 | ||||||||||||||||
| Luxembourg | per USD | 0.993 | 0.980 | 0.932 | 0.919 | 0.919 | ||||||||||||||||
| Netherlands | per USD | 0.993 | 0.980 | 0.932 | 0.919 | 0.919 | ||||||||||||||||
| Norway | per USD | 9.99 | 10.2 | 10.2 | 10.7 | 10.5 | ||||||||||||||||
| Poland | per USD | 4.71 | 4.65 | 4.39 | 4.18 | 4.14 | ||||||||||||||||
| Sweden | per USD | 10.6 | 10.7 | 10.4 | 10.5 | 10.8 | ||||||||||||||||
| United Kingdom | per USD | 0.850 | 0.853 | 0.823 | 0.799 | 0.790 |
 Helgi Library


