
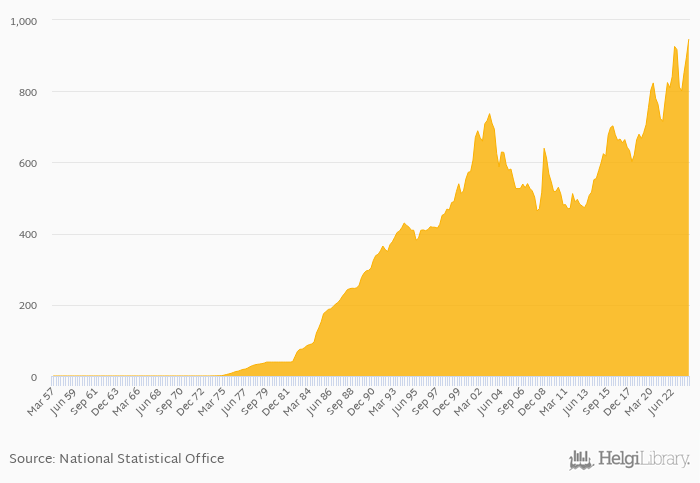
Average FX rate to USD rose 16.6% yoy to 946 per USD in Chile in 1Q2024, according to the National Statistical Office. This is 5.68% more than in the previous quarter.
Historically, Average FX rate to USD in Chile reached an all time high of 946 per USD in 1Q2024 and an all time low of < 0.001 per USD in 1Q1957.
Chile has been ranked 10th within the group of 121 countries we follow in terms of Average FX rate to USD, 12 places above the position seen 10 years ago.
| FX Rate to USD (Average) | Unit | Mar 2019 | Jun 2019 | Sep 2019 | Dec 2019 | Mar 2020 | Jun 2020 | Sep 2020 | Dec 2020 | Mar 2021 | Jun 2021 | Sep 2021 | Dec 2021 | Mar 2022 | Jun 2022 | Sep 2022 | Dec 2022 | Mar 2023 | Jun 2023 | Sep 2023 | Dec 2023 | Mar 2024 |
| Argentina | per USD | 136 | 162 | 192 | 232 | 312 | ||||||||||||||||
| Bolivia | per USD | 6.91 | 6.91 | 6.91 | 6.91 | 6.91 | ... | |||||||||||||||
| Brazil | per USD | 5.25 | 5.26 | 5.19 | 4.95 | 4.88 | ||||||||||||||||
| Chile | per USD | 926 | 917 | 812 | 801 | 852 | ||||||||||||||||
| Paraguay | per USD | 6,906 | 7,199 | 7,283 | 7,211 | 7,274 | ||||||||||||||||
| Peru | per USD | 3.89 | 3.90 | 3.82 | 3.70 | 3.68 | ... | |||||||||||||||
| Uruguay | per USD | 40.8 | 40.0 | 39.2 | 38.6 | 38.0 |
 Helgi Library


